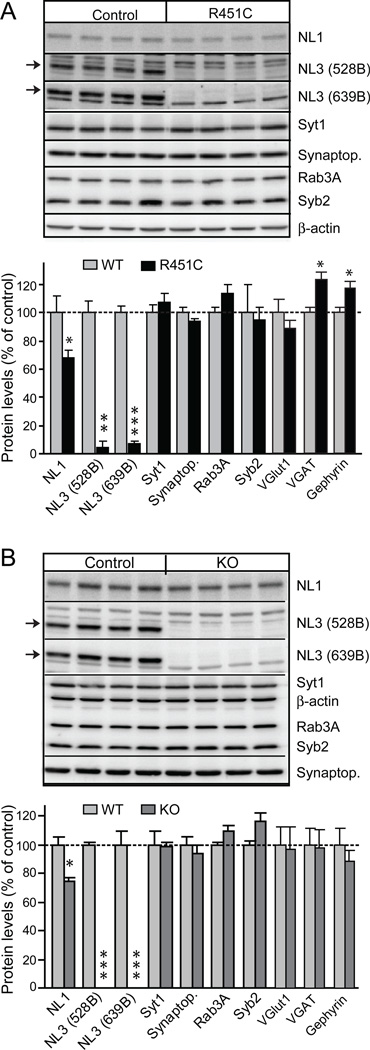
Figure 1.
Generation and characterization of neuroligin-3 R451C KI and neuroligin-3 KO mice. (A and B) Representative immunoblots and summary graphs of protein levels in the brains of neuroligin-3 R451C KI mice (A) and neuroligin-3 KO mice (B). Selected synaptic proteins (NL1, neuroligin-1; NL3, neuroligin-3; Synaptop., synaptophysin; Syt1, synaptotagmin-1; Syb2, synaptobrevin-2) were analyzed by quantitative immunoblotting; two different neuroligin-3 antibodies were used (528B and 639B; arrows point to neuroligin-3 band; data shown are means ± SEMs; n=4 littermate pairs; * = p<0.05; ** = p<0.01; *** = p<0.005 by Student's t-test).

