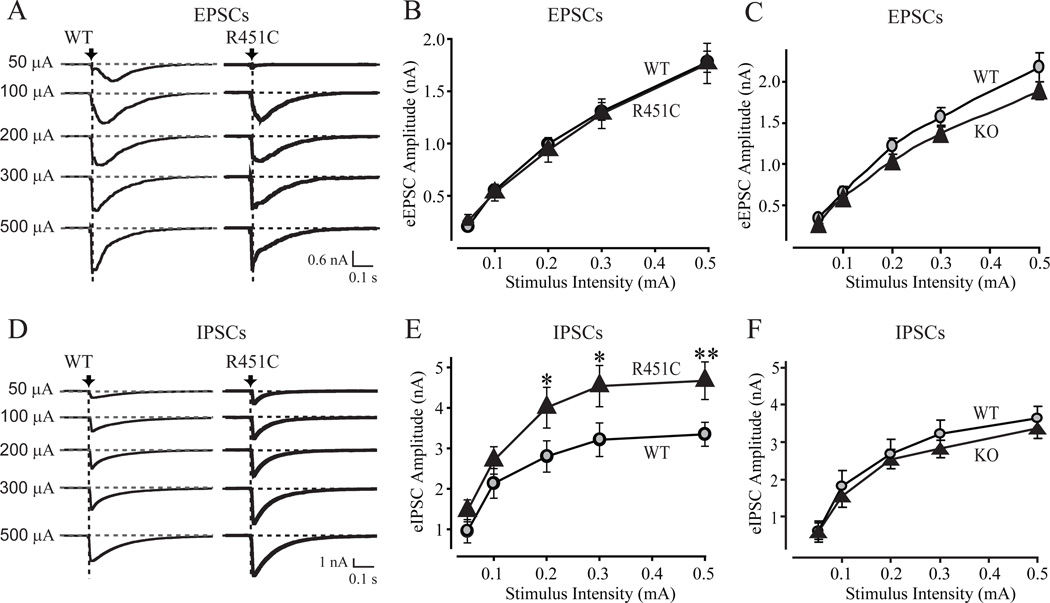
Figure 4.
Selective increase in inhibitory synaptic strength in neuroligin-3 R451C KI but not in neuroligin-3 KO mice. Representative traces (A and D) and summary graphs (C, D, E and F) of synaptic responses induced with increasing stimulus intensities applied with a local microelectrode in acute slices of the somatosensory cortex from littermate pairs of R451C KI mice (A, B, D, and E) or KO mice (C and F). Recordings were obtained in the whole-cell mode in layer 2/3. EPSCs (A-C) and IPSCs (D-F) were analyzed separately after pharmacological isolation. In A and D, arrows and vertical dashed lines indicate peaks measured for determining evoked response amplitude. Dotted horizontal lines represent baselines. All data were recorded in acute slices from littermate R451C-mutant and wild-type mice (data shown are means ± SEMs; n=4 or 3 littermate pairs for EPSCs (KI or KO), and 5 or 3 littermate pairs for IPSCs (KI or KO); * = p<0.05; ** = p<0.01 by t-test). For representative traces from the KO mice, see Fig. S9; for short-term plasticity measurements in KI and KO mice, see Figs. S10–13.

