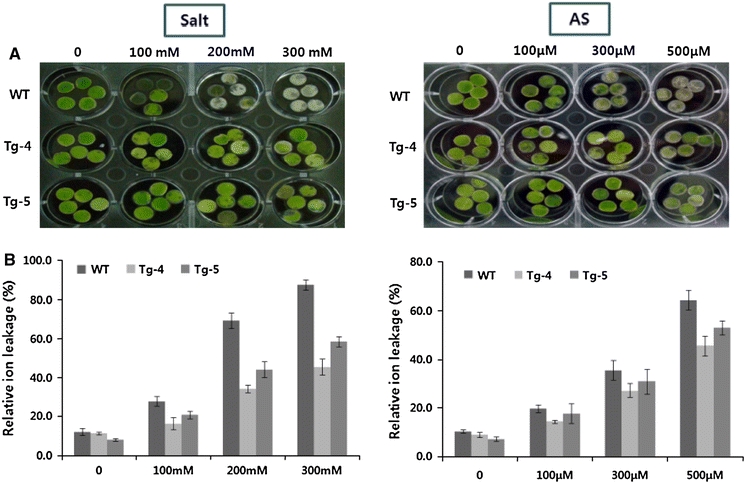
Fig. 4.

Visible damage in the detached leaves of control and transgenic plants exposed to salt and arsenic for 48 h (a), and the effects of salt and arsenic treatments on the relative ion leakage in the leaves of control and transgenic plants (b). The data represent the means and standard deviation (SD) of three independent measurements. The height of each bar represents the average of three individual identical experiments (±SE). The mean value of each transgenic line represents a statistically significant difference compared to the control, as determined by the LSD t test (P < 0.05)
