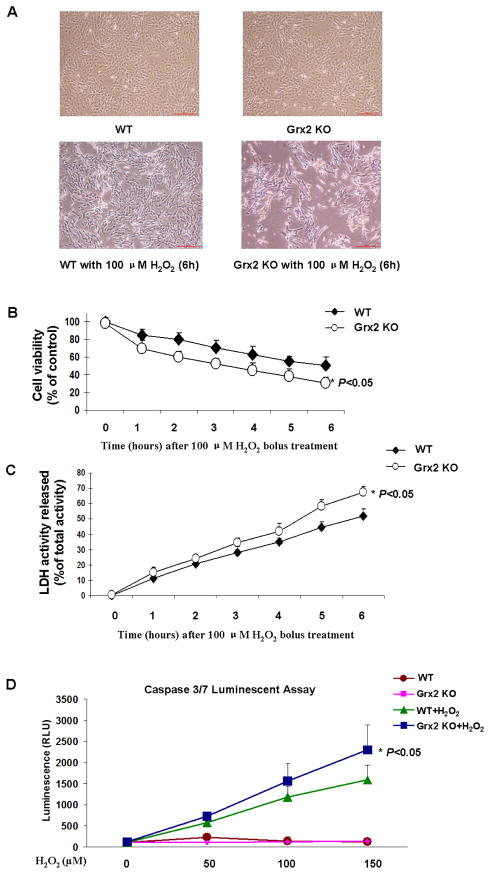
Fig. 2. Effect of H2O2 in wild type (WT) and Grx2 knockout (Grx2 KO) lens epithelial cells.
(A) Comparison of the cell density and morphology after H2O2 treatment. WT and Grx2 Grx2 KO primary mouse LECs were treated with or without 100 μM H2O2 for 6 hrs. After treatment, cell morphology was observed under phase contrast microscopy. (B) Effect of H2O2 on cell viability in WT and Grx2 KO cells. WT and Grx2 KO primary mouse LECs were plated in 96-well plate (all normalized to 10,000 cells/well) and treated with or without 100 μM H2O2 at for indicated times. Cell viability in each time point was measured by adding WST-8 reagent and then the transmission was evaluated under 450 nm using a 96-well microplate reader. Error bars indicate S.D., n=3, *P<0.05 vs. WT treated with H2O2. (C) Effect of H2O2 on LDH release in WT and Grx2 KO cells. Wild type and Grx2 knockout primary mouse LECs were treated with or without 100 μM H2O2 at different time point from 0 to 6 hours. LDH activity was measured as described as under “Materials and methods”. Error bars indicate S.D., n=3, *P<0.05 vs. WT treated with H2O2. (D) Effect of H2O2 on caspase 3/7 activation in WT and Grx2 KO cells. Wild type and Grx2 knockout primary mouse LECs were plated in 96-well plate (all normalized to 10,000 cells/well) and treated with 0, 50, 100 and 150 μM H2O2, respectively for 6 hrs. Caspase 3/7 activity was measured by using luminogenic substrate containing the DEVD sequence. Error bars indicate S.D., n=3, *P<0.05 vs. WT treated with H2O2.

