
Figure 5.
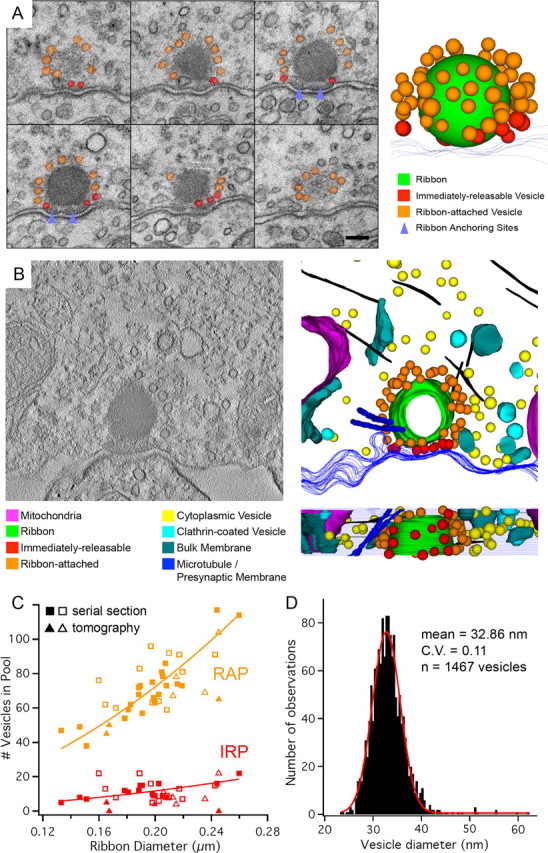
Serial section and electron tomographic reconstruction of ribbon synapse vesicle populations. A, Exemplar set of consecutive 50-nm-thick serial sections imaged at 40,000× and used to reconstruct and count ribbon-associated vesicles. Scale bar, 100 nm. B, The 200 nm-thick sections were used to collect tilt series of projection images, from which tomograms (left) were generated. Subsequent reconstruction of these tomograms (right) provided another means for quantifying anatomical vesicle pools. Clathrin-coated pits and mitochondria were frequently observed near reconstructed ribbons. Microtubules (purple) and actin filaments (black) were also observed, sometimes in close proximity to the ribbon and its vesicle pools. C, A plot of ribbon diameter versus vesicle pool sizes for two fixation methods and two ultrastructural reconstruction methods. The total RAP is orange, while the IRP is in red. Serial section (squares) and electron tomography (triangles) data are displayed for high Ca2+ (filled markers) and zero Ca2+ (empty markers) fixation conditions. We defined the total ribbon-attached pool as all vesicles <30 nm from the ribbon, and the docked “bottom row” pool as all vesicles <30 nm from the ribbon and also <20 nm from the presynaptic membrane. Because electron tomography provides sufficient resolution to observe vesicles touching the presynaptic membrane (e.g., no gaps), we report this value for the IRP for the tomography data. Because the average ribbon size per cell varies slightly, second-order polynomial fits of our reconstruction data allow us to calculate the estimated vesicle pools for hair cells with ribbons of various sizes. D, The distribution of ribbon-associated vesicle diameters (n = 1467 vesicles) has a mean of 32.9 nm (CV = 0.11) and is well fit by a Gaussian function (red).