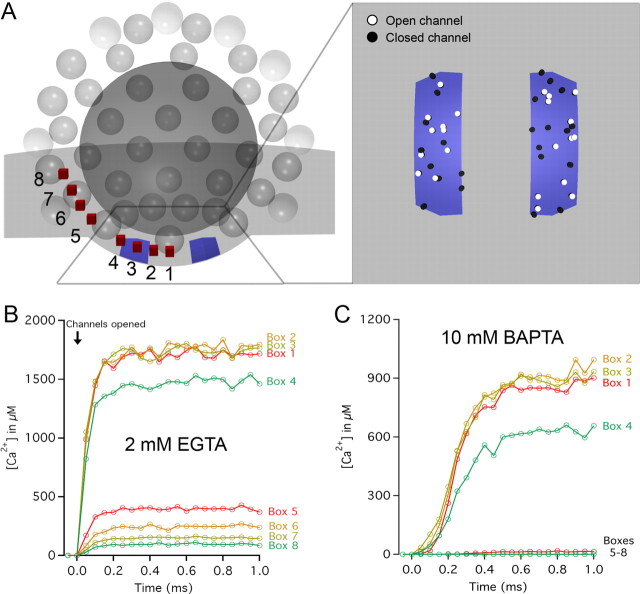
Figure 7.
Monte Carlo simulations of Ca2+ diffusion near the synaptic ribbon. A, A rendering of a cross-section of the model used for Ca2+ influx simulation. Forty-five Ca2+ channels were randomly tiled within two stripes of designated presynaptic membrane (blue; see inset for top-down view). To simulate a depolarizing pulse corresponding to a membrane potential of −30 mV, each open channel was given a constant current of −0.4 pA, yielding a synaptic current of approximately −9 pA. The concentration of free Ca2+ was monitored every 50 μs at eight locations (10 nm boxes; red) spanning from underneath the ribbon (Box 1) to the second row of synaptic vesicles away from the presynaptic membrane (Box 8). The free Ca2+ concentration as a function of time after channel opening is shown for 2 mm EGTA (B) and 10 mm BAPTA (C) presynaptic Ca2+ buffering conditions. A sharp drop in concentration is evident for both conditions across the transition from underneath the ribbon (Boxes 1–4) to the periphery of the ribbon (Boxes 5–8). Data in B and C represent the averages of eight simulations run with different random number seeds.

