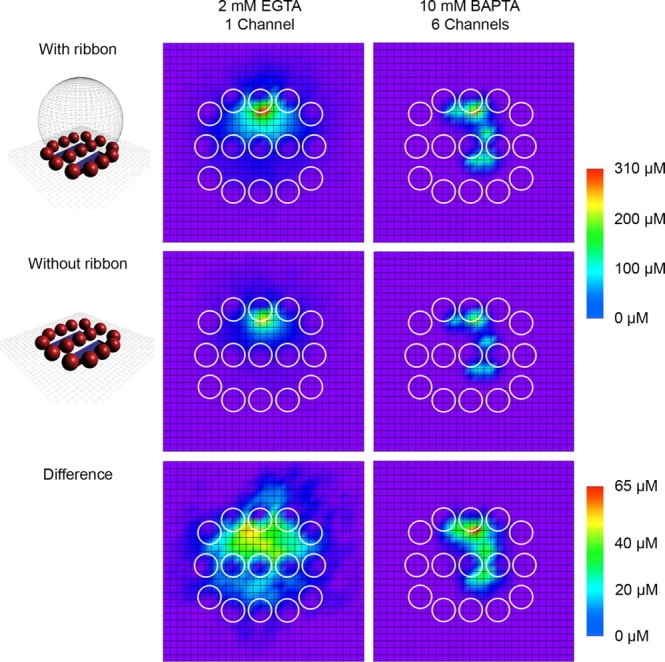
Figure 8.

The spatial profile of Ca2+ underneath the synaptic ribbon. A separate set of simulations was created to describe the spatial extent of local Ca2+ microdomains and the influence of the ribbon. A 30 × 30 grid of 10 nm boxes were used to monitor free Ca2+ concentration at the presynaptic membrane surface over time while different numbers of channels were opened. To facilitate the grid design, the ribbon was considered a sphere with a flat cap removed to maintain a flat contact area with the presynaptic membrane. Vesicle outlines are depicted as circles within the grid. Shown are free Ca2+ concentrations averaged over 1 ms beginning 5 ms after channel opening. In 2 mm EGTA Ca2+ buffering conditions (left column), a single open channel (i = −0.54 pA, as expected at Vm = −70 mV) resulted in widespread, large free Ca2+ nanodomains. The presence of the ribbon as a diffusion barrier and restrictor of space led to an enhancement in Ca2+ concentration of tens of micromolar for hundreds of square nanometers. A comparable peak Ca2+ concentration was possible in 10 mm BAPTA buffering conditions (right column) by opening six channels (i = −0.5 pA, as expected at Vm = −60 mV). Although the spatial spread of free Ca2+ under 10 mm BAPTA conditions was restricted relative to 2 mm EGTA conditions, the presence of the ribbon as a diffusion barrier remained capable of enhancing Ca2+ concentration.
