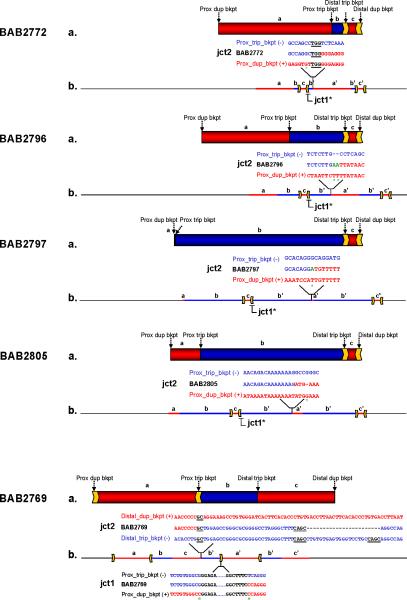
Figure 4. Rearrangement structure for patients BAB2769, BAB2772, BAB2796/BAB2980, BAB2797 and BAB2805 based on aCGH, Southern blotting and breakpoint sequencing.
(a) Genomic region harboring duplications and triplications spanning chromosome Xq28 according to aCGH: duplications are represented in red, triplications in blue. Arrows on top of the rearrangements indicate the position of the breakpoints; inverted repeats involved in the rearrangement are represented as yellow arrows. Letters a, b and c represent the segments with copy-number gain. (b) Individual genomic structure of the region involved in the rearrangement as inferred by analysis of breakpoint junction 1 (jct1) and breakpoint junction 2 (jct2) for each patient. Jct1* represents those junctions analyzed by Southern blotting (please refer to Fig. 3); all others were sequenced. Genomic positions of each of the junctions are shown. Breakpoint junction sequences are color-coded to highlight their segment of origin in the reference genome (duplications in red and triplications in blue). The triplicated segment (b’) is inserted amid a normal (a, b, c) and a duplicated copy (a’, c’) in inverted orientation as supported by jct1 and jct2 analysis. This structure was further confirmed by FISH for patient BAB2805 (Supplementary Fig. 6). Microhomologies observed at the junctions are represented by underlined black letters; insertions or mismatches at the junctions are represented in green; deletions are represented by dashes; mismatches between the reference sequences and patient sequences are marked with a green asterisk underneath.

