
Figure 3.
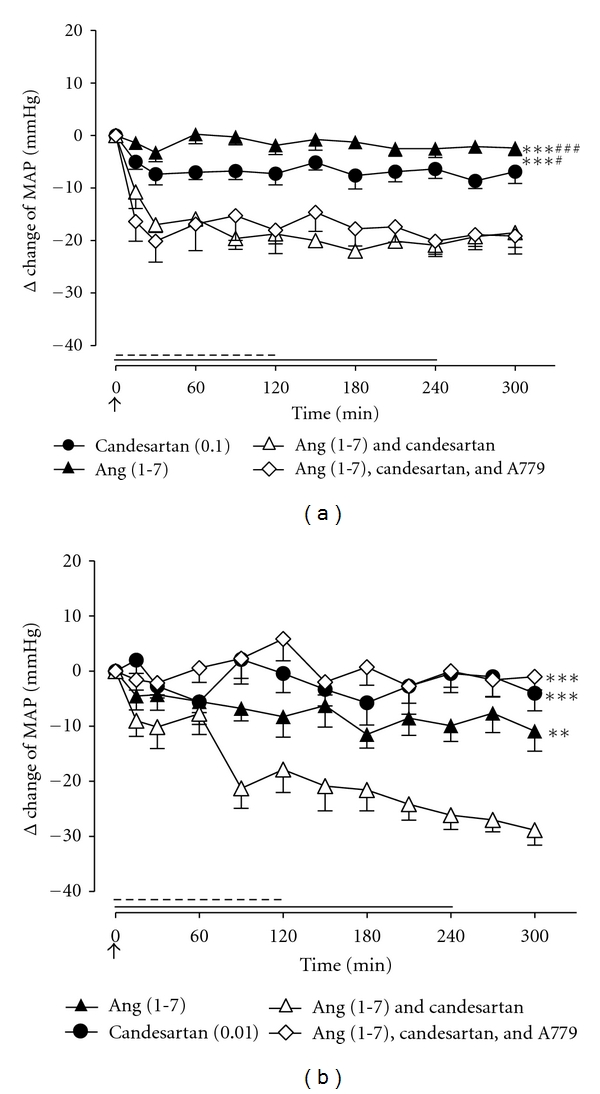
Effect of Ang (1-7) (15 pmol/kg/min; 4-hour infusion depicted by full line), AT1R antagonist, and candesartan in (a) adult WKY rats (0.1 mg/kg bolus IV; depicted by an arrow) and (b) aged WKY rats (0.01 mg/kg bolus IV; depicted by an arrow), together with Ang (1-7) + candesartan and Ang (1-7) + candesartan + MasR antagonist A779 (15 pmol/kg/min for 2 hours; depicted by dashed line), on MAP (n = 8 for both groups). Values represent mean ± SEM. (a) ***P < 0.001, for treatment effect of Ang (1-7) + candesartan versus Ang (1-7) or candesartan alone (2-way RM ANOVA), †<0.05; †††<0.001, for treatment effect of Ang (1-7) + candesartan +A779 versus candesartan or Ang (1-7) alone (2-way RM ANOVA). (b) **P < 0.01; ***<0.001 for treatment effect of Ang (1-7) + candesartan versus Ang (1-7), candesartan, or Ang (1-7) + candesartan + A779 (2-way RM ANOVA).