
Figure 2.
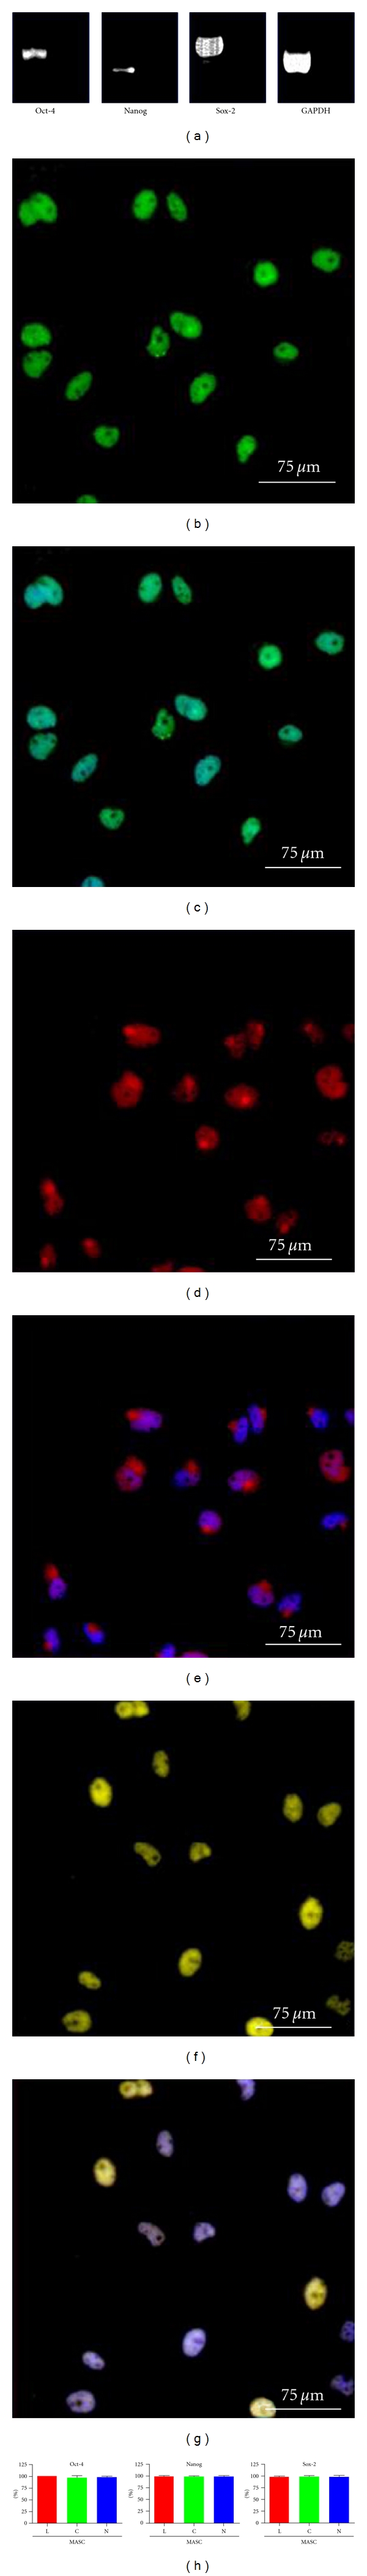
Pluripotent state-specific transcription factor expression. (a) Representative RT-PCR analysis of Oct-4, Sox-2, Nanog, and GAPDH mRNA transcripts in N-MASCs. The right lane of each gel is the negative control (H2O). (b–g) Oct-4 (green fluorescence; (b–c)), nanog (red fluorescence; (d, e)), and sox-2 expression (yellow fluorescence; and (f, g)) in the nuclei of C-MASCs. Nuclei are depicted by the blue fluorescence of DAPI staining (c, e, g). (h) Quantification of pluripotent state-specific transcription factor expression. Data are presented as mean ± standard deviation.