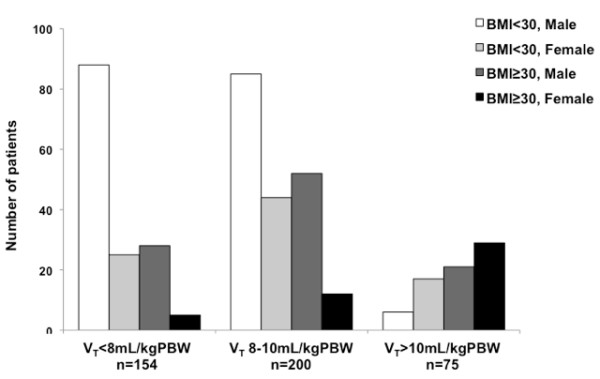
Figure 2.

Distribution of obesity and gender on the intraoperative tidal volume (VT) subgroups. The distribution was significantly different between subgroups (p ≤ 0.001), with most patients in the < 8 mL/kg PBW being non-obese (73.3%) and males (75.3%) but obese (66.7%) and females (61.4%) in the > 10 mL/kg PBW subgroup. There was missing information from 8 patients in the < 8 mL/kg PBW subgroup, 7 patients in the 8-10 mL/kg PBW subgroup and 2 patients in the > 10 mL/kg PBW subgroup (5%, 3.5% and 2.7%, respectively) that precluded their classification.
