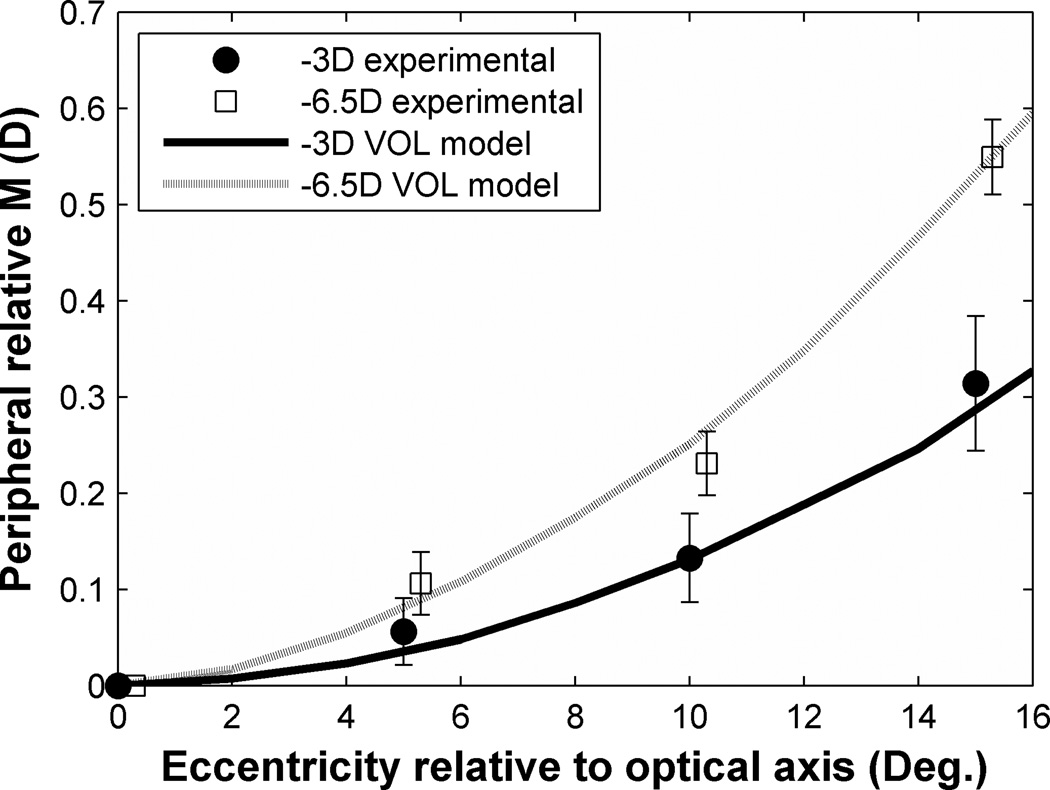
Figure 5.
Optical prediction and experimental data of the change of PRM with increased off-axis viewing. X axis refers to eccentricities relative to the optical axis. Dotted and solid curves indicate predicted values of PRM from VOL calculation with visual field eccentricities increasing. Filled circle symbols indicate the experimental data of −2D myopic eye and open square symbols indicate the experimental data of −6.5D myopic eye. Error bars indicate the standard error of the mean (SEM) in each set of measurements. For clarity, symbols and error bars are slightly staggered horizontally.

