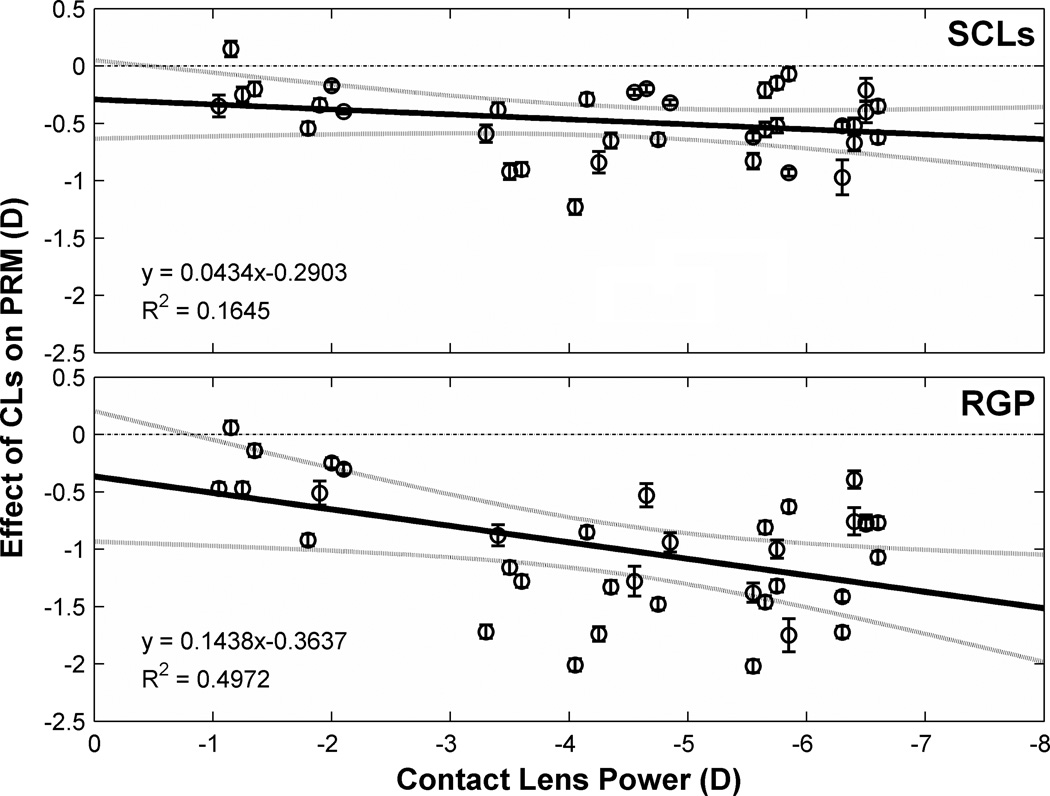
Figure 9.
Effect of CLs on PRM as a function of CLs power. Y axis indicates the effect of CLs, computed as (PRM with CLs correction – PRM without CLs correction). Data points represent mean value of three measurements at each visual field eccentricities for a given eye. The y=0 dashed lines is the prediction if CLs with variant powers have no effect on PRM. Solid lines are orthogonal regression lines fitted on the data points and dotted curves show 95% confidence interval of these regression lines. Error bars are SEM of the three measurements in a certain visual angle. For clarity, symbols and error bars are slightly staggered horizontally.

