
Figure 2. Group comparison using regions of interest (ROIs) analysis on DTI indices.
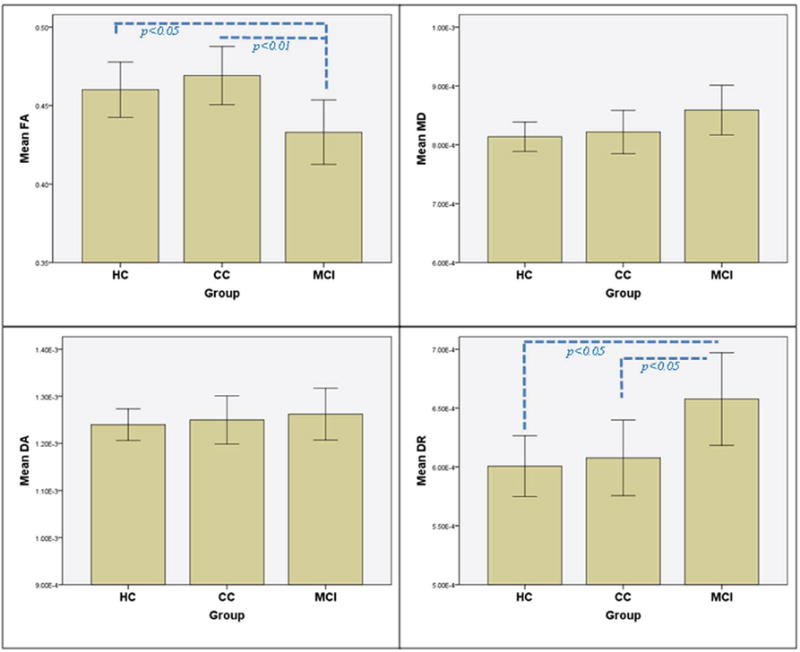

Group comparison of DTI indices in (A) left parahippocampal white matter and (B) right parahippocampal white matter. Age and sex adjusted means (± SE). (FA = fractional anisotropy; MD = mean diffusivity; DR = radial diffusivity; DA = axial diffusivity).