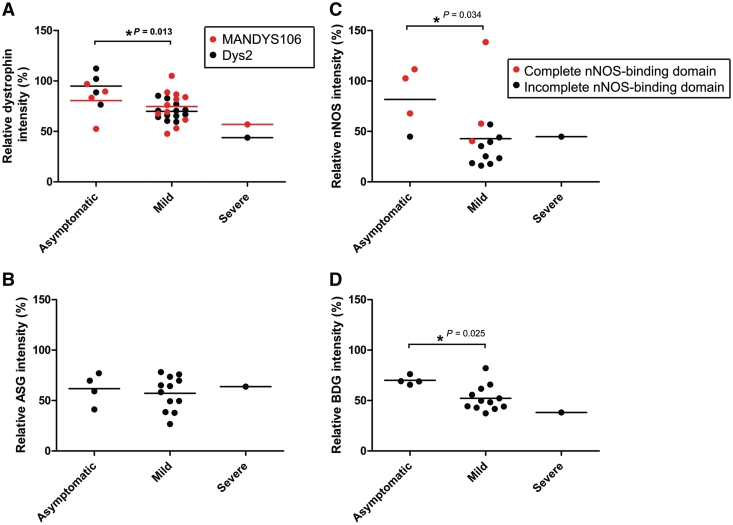
Figure 5.
Correlation of dystrophin and dystrophin-associated protein expression with clinical severity. Clinical severity correlated to dystrophin expression with both MANDYS106 (red) and Dys2 (black) antibodies (A), α-sarcoglycan (ASG) (B), nNOS (C) and β-dystroglycan (BDG) (D) expression. Lines represent mean expression of each group. P-values are shown for statistically significant differences and were determined using a two-tailed Mann–Whitney test.

