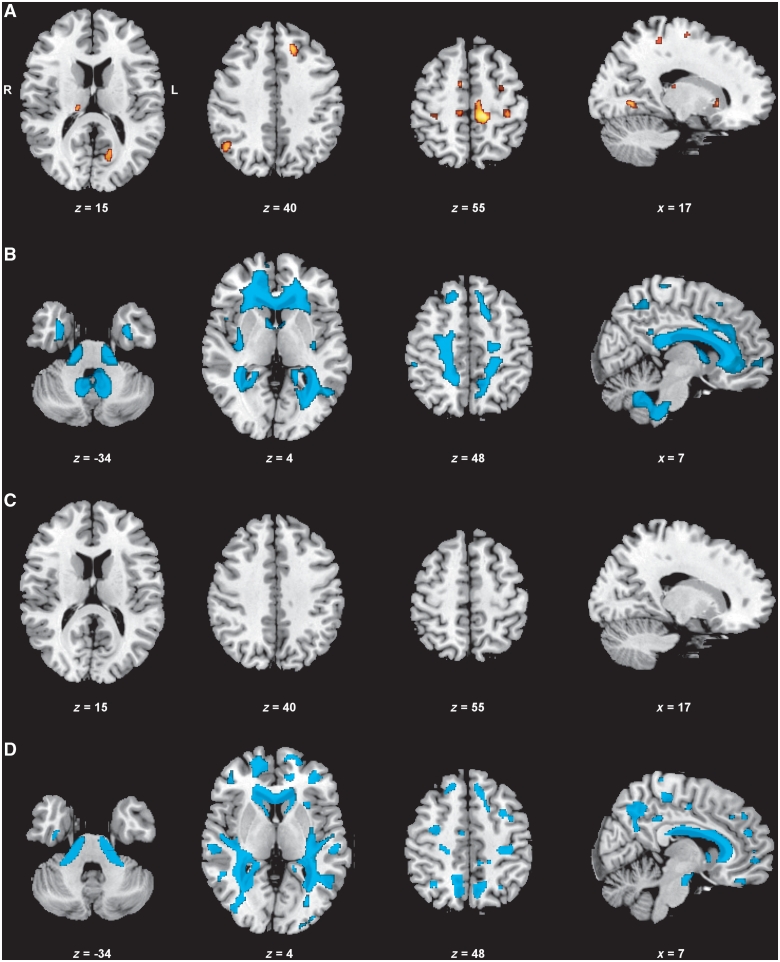
Figure 1.
Neuroimaging results of the brain (VBM, group comparisons). Displayed results of VBM analyses are based on a threshold of Pfalse discovery rate < 0.05 at voxel-level with an extended cluster threshold of 10 voxels. The coordinates refer to the MNI reference space. (A) Grey matter decrease in patients with myotonic dystrophy type 1 compared with controls. (B) White matter decrease in patients with myotonic dystrophy type 1 compared with controls. (C) Grey matter decrease in patients with myotonic dystrophy type 2 compared with controls (no clusters detected). (D) White matter decrease in patients with myotonic dystrophy type 2 compared with controls.

