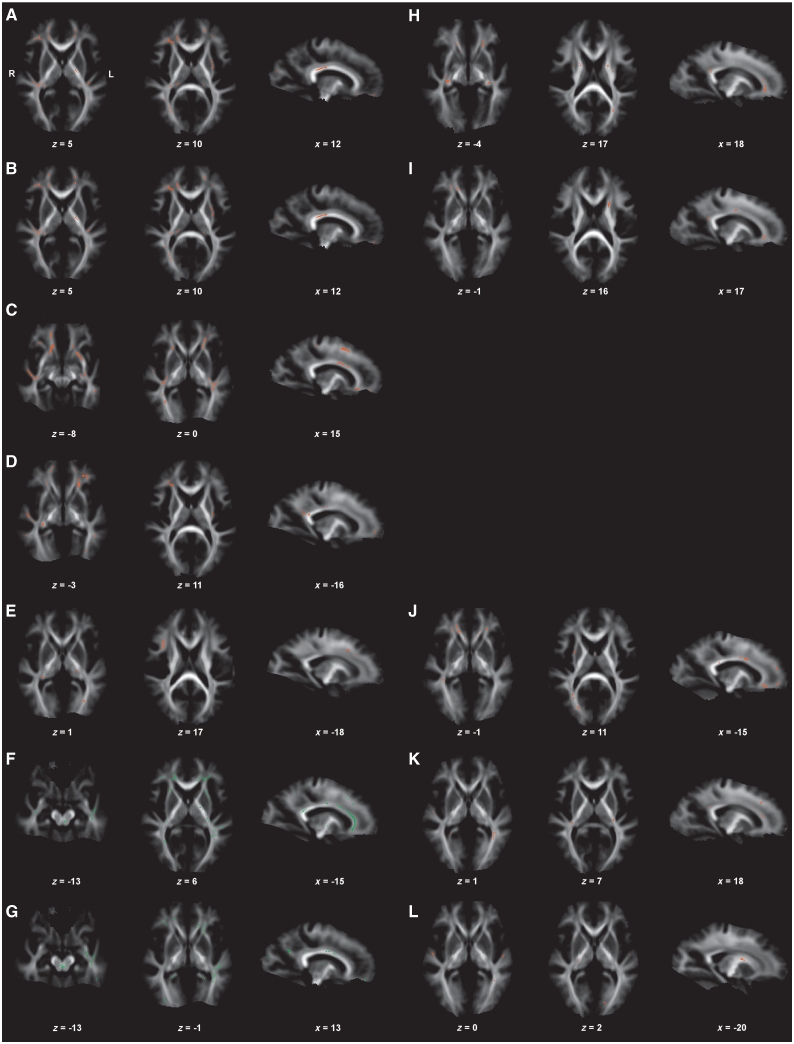
Figure 4.
Neuroimaging results of the brain (DTI, correlation analyses between white matter affection (fractional anisotropy values) and clinical parameters). Correlation analyses in myotonic dystrophy type 1 (A–G) and myotonic dystrophy type 2 (H–L). Displayed results of Tract-based spatial statistics analyses of fractional anisotropy values are based on a corrected threshold of Pthreshold-free cluster enhancement < 0.05. Mean tract-based spatial statistics tract skeleton is overlaid on the mean fractional anisotropy image (display threshold of 0.1). The coordinates refer to the MNI reference space. Correlations of fractional anisotropy values in patients with myotonic dystrophy type 1 with age and disease duration (A and B), CTG repeat length (C), Muscular Impairment Rating Scale score (D), motor performance (E). Positive correlation of fractional anisotropy values in patients with myotonic dystrophy type 1 with depressed mood (BDI score, F) and fatigue (KFSS score, G). Correlations of fractional anisotropy values in patients with myotonic dystrophy type 2 with age (H), disease duration (I) and motor performance (J). Negative correlations of fractional anisotropy values in patients with myotonic dystrophy type 2 with depressed mood (BDI score, K) and fatigue (KFSS score, L).

