
FIGURE 4.
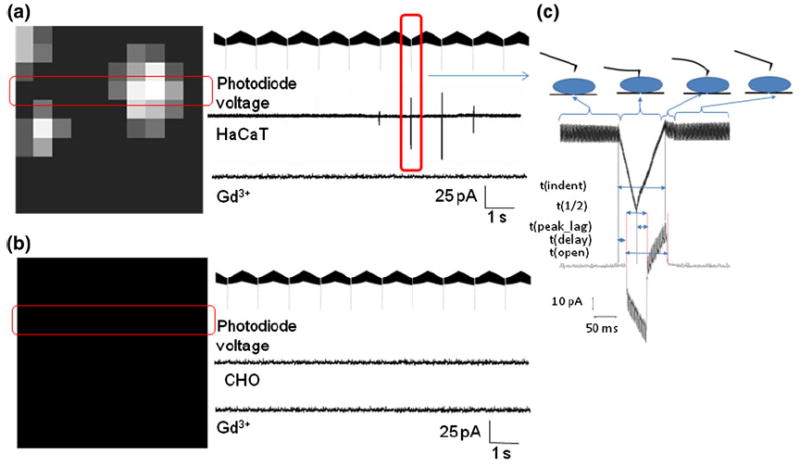
Current map in response to indentation by an AFM cantilever. (a) For HaCaT cell: (left) representative current response to 10 × 10 grid of indentations over a 5 × 5 μm area; (right) voltage output from the AFM photodiode representing cantilever deflection, followed by current response from the highlighted row, followed by the current response from the same row after addition of GdCl3. (b) For CHO cell. (c) High-resolution view of current response for a single indentation. The cartoon on the right shows various stages of cantilever movement corresponding to the photodiode voltage read-out. Parameters: t(ind), time over which cantilever is in contact with cell membrane; t(1/2), time between onset of current and current peak value; t(max_depth), time between the max indentation depth and current peak; t(delay), time between membrane contact and onset of current; t(i), time over which the channels are open.