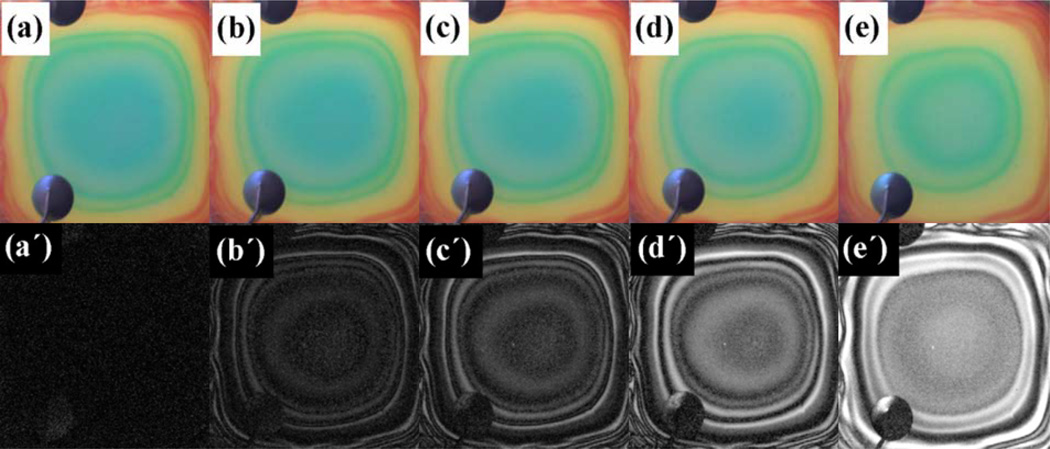
Figure 5.
Optical photographs (a through e) and difference images (a´ through e´) of a porous silicon Bragg mirror exposed to ethanol vapor at concentrations of (a) 0 ppm, (b) 140 ppm, (c) 2000 ppm, (d) 10,000 ppm and (e) 22,500 ppm. The difference images are multiplied by a factor of 10 to show the changed segments of color clearly (from ref. 31).

