
Figure 2.
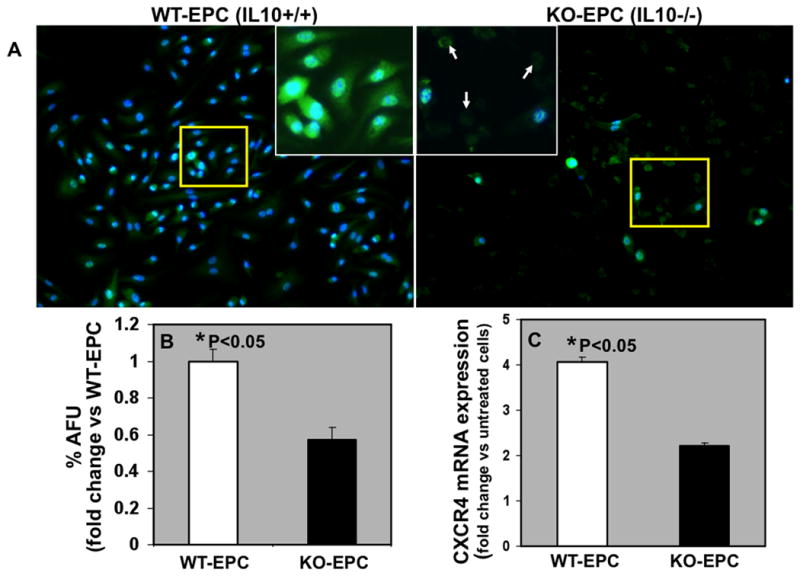
A. Immunofluroscence staining for CXCR4 protein expression (green) in EPCs from WT (WT-EPC) and IL-10 KO-mice (KO-EPC) and DAPI (blue) for nuclear staining. Inset is higher magnification of the yellow-boxed area. Also, IL-10 deficient EPCs showed increased cell death (arrows; rounding and no clear nuclear staining). B. Bar graph depicting semi-quantitative analysis of CXCR4 fluorescence signal expressed as % Arbitrary Fluorescence Units (%AFU). C. Real time-PCR data for CXCR4 mRNA expression in EPCs in response to LPS. mRNA expression normalized to 18S and depicted as fold change vs control untreated cells. CXCR4 expression (mRNA and protein) was lower in KO-EPCs as compared to WT-EPCs (*P<0.05 versus KO-EPC).