
Figure 3.
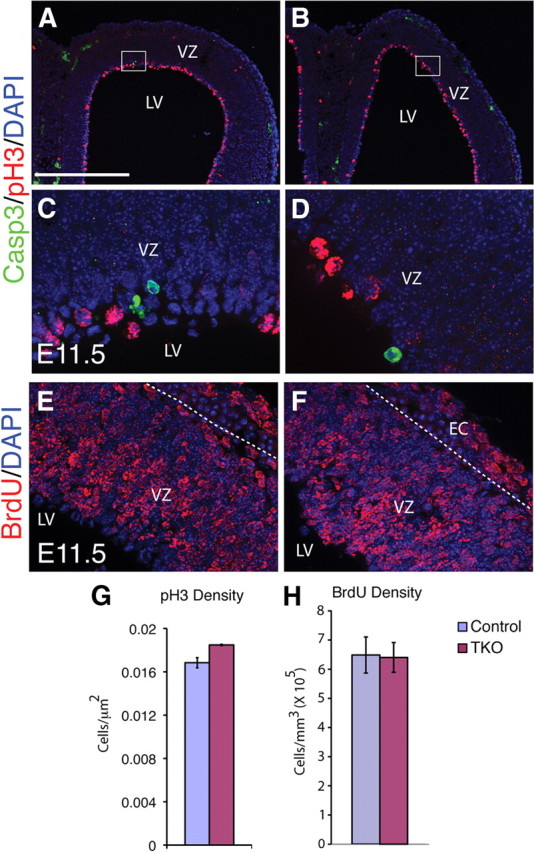
Caspase 3-mediated cell death and proliferation appear unchanged in Emx1;TKOs at E11.5. A–D, Isolated Caspase 3 (Casp-3)+ cells (green) were detectable in control (A, C) and Emx1;TKO embryos (B, D); however, they were extremely rare. C and D are high-power images of the boxed regions in A and B. In these brains we estimated 952 Casp-3+ cells per cortical hemisphere (Emx1;TKO) vs 624 cells in wild type. E–H, Positive cells were often found far from the lateral ventricles, in the SVZ or preplate, but some were also observed in the VZ. PH3 (red) labels mitotic cells primarily at the VZ surface at E11.5 in both control and Emx1;TKO embryos, and the number was only modestly different (G). BrdU incorporation at E10.5 was imaged and quantified after 1 d survival (E, F, H), and was nearly identical in both control and Emx1;TKO embryos (H). EC, ectoderm. Scale bars: A, B, 500 μm; C–F, 62.5 μm.