
Figure 4.
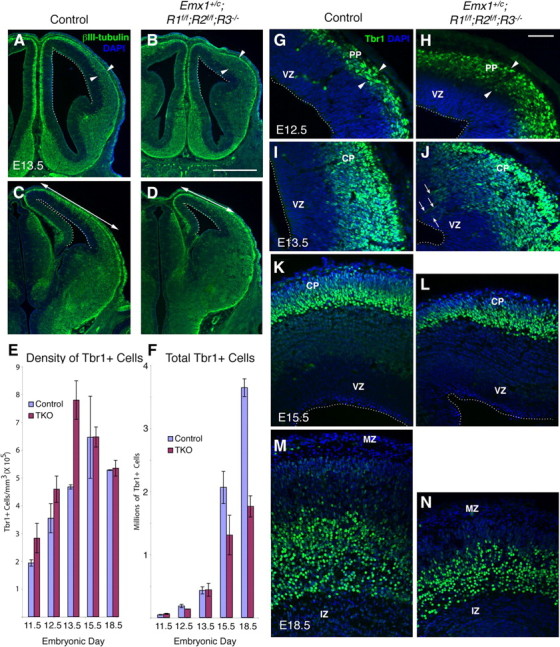
Early excess of cortical neurons and later deficit in Emx1;TKOs. βIII tubulin (A–D) and Tbr1 (G–N) immunostaining showing excess early cortical neurons at E12.5 (G, H) and E13.5 (I, J), and increased preplate/cortical plate thickness (arrowheads in A, B) in mutants compared with control littermates. By E15.5 (K, L) thinning of the cortical plate begins and the final number of Tbr1+ neurons is decreased by 51.7% in Emx1;TKOs at E18.5 (M, N). Stereological estimates of Tbr1+ cell density and total number are plotted in E and F, respectively. A factorial ANOVA showed a main effect of genotype (F = 45.7; p < 0.0001), age (F = 245.1; p < 0.0001), and interaction of genotype * age (F = 29.6; p < 0.0001) (n = 10 Emx1;TKOs and 11 littermate controls) on the total number of Tbr1+ neurons, and a main effect of genotype (F = 7.88; p < 0.017) and age (F = 16.18; p = 0.0001) on Tbr1+ cell density. PP, Preplate; MZ, marginal zone; IZ, intermediate zone. Scale bars: A–D, 1 mm; G–N, 125 μm.