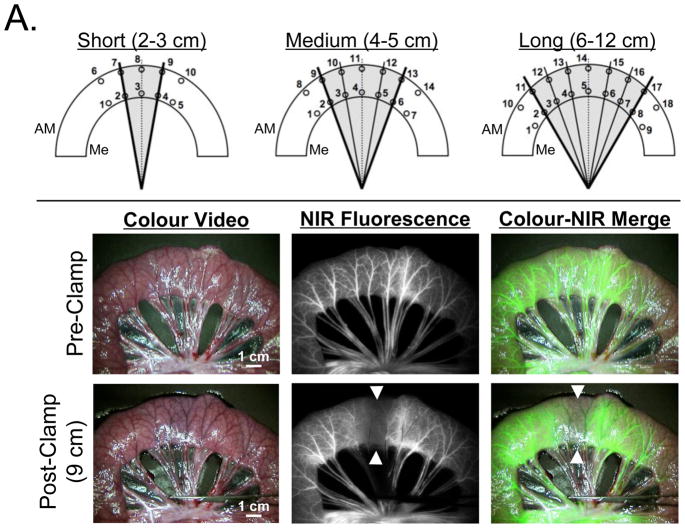
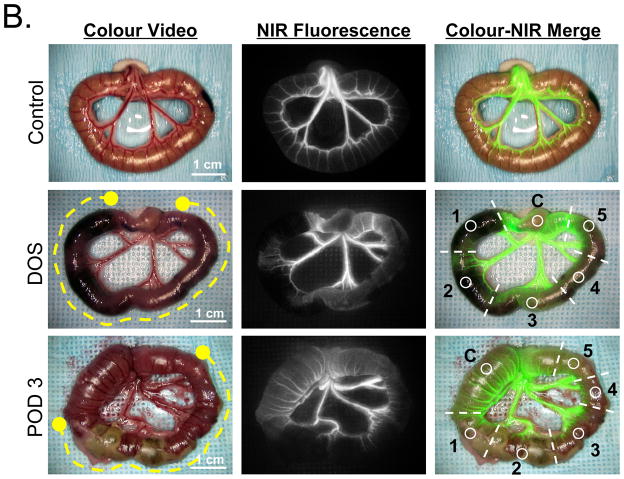
Figure 1. Experimental preclinical models of bowel ischemia and NIR fluorescence angiography.
A. Pig Model: Various lengths of ischemic bowel sections (gray shading). ROIs of subsections on the mesenteric side (Me) and anti-mesenteric side (AM) were numbered as shown (see also Supplementary Tables S1 and S2). NIR fluorescence angiography before (pre-clamp) and after (post-clamp) induction of ischemia (arrowheads) via mesenteric vascular occlusion. The length of ischemia is 9 cm (long ischemic segment group). Shown are the colour video image (left), NIR fluorescence image (centre), and a pseudo-coloured (lime green) merged image of the two (right) at 1 min postinjection of 0.05-mg/kg ICG. Camera exposure time (60 ms) and normalizations are identical for NIR fluorescence images.
B. Rat Model: Typical NIR fluorescence angiography results seen under control conditions (Control; top) and intraoperatively after 2 h of strangulation on the day of surgery (DOS; middle row) and 3 days postoperatively (POD 3; bottom row). Shown are the colour video image (left), NIR fluorescence image (centre), and a pseudo-coloured (lime green) merged image of the two (right) at 40 s postinjection of 0.15-mg/kg ICG. The yellow dashed lines in the colour video mark the extent of strangulation. Camera exposure time (60 ms) and normalizations are identical for NIR fluorescence images. Each bowel was divided into 5 numbered sub-sections with a single ROI (circle) placed in each. An additional ROI was placed over normal bowel as a control (C).


