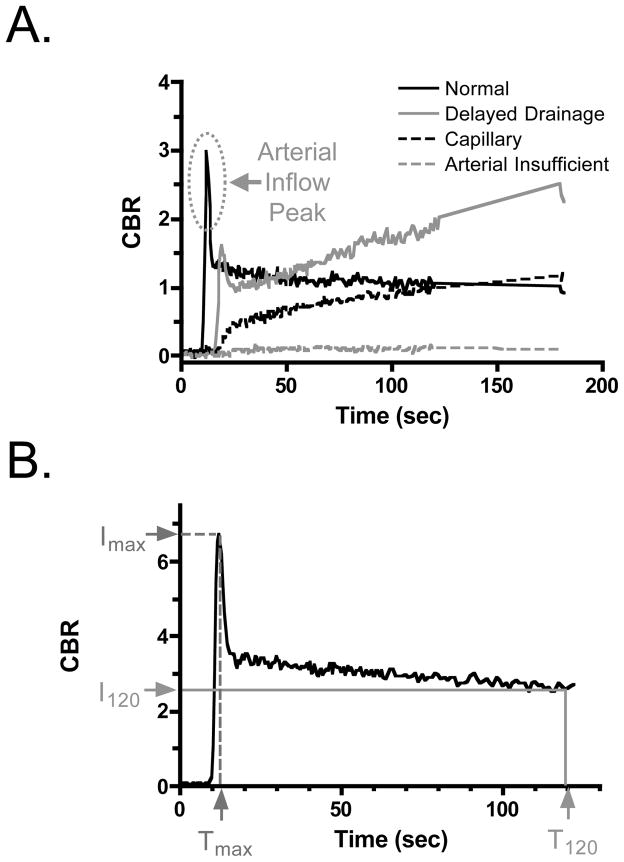
Figure 2. Qualitative and quantitative metrics derived from NIR fluorescence angiography.
A. Qualitative patterns of vascular filling seen during the first 3 min after ICG injection. The arterial inflow peak seen under normal conditions is indicated.
B. Quantitative metrics were derived from the CBR at peak arterial inflow (Imax) and its corresponding time (Tmax), and the plateau CBR seen at T = 120 s (I120) after ICG injection. The drainage ratio (DR) is defined as I120/Imax × 100.

