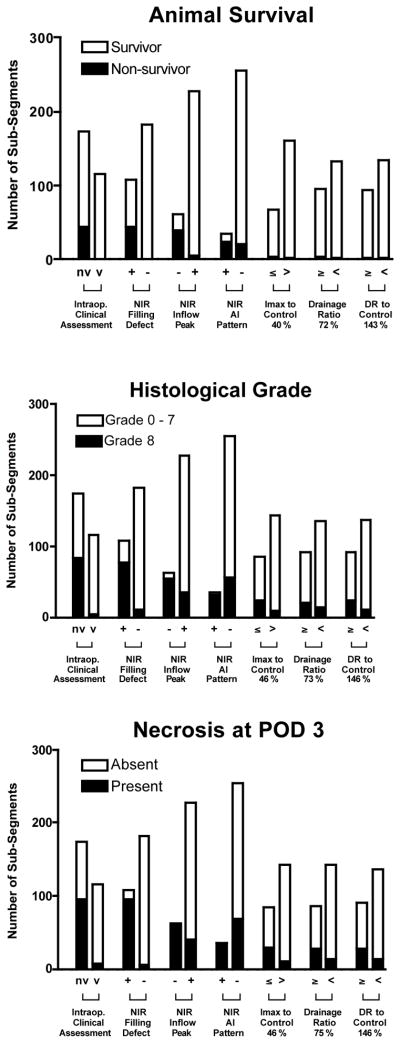
Figure 3. Clinical outcomes as a function of clinical assessment, qualitative CBR-time curve metrics, and quantitative CBR-time curve metrics.
Shown are animal survival (top), histological grade (middle), and clinical necrosis on post-operative day 3 (bottom) as a function of the metrics shown and the number of bowel sub-segments involved. nv = nonviable, v = viable. + = feature present. - = feature absent.

