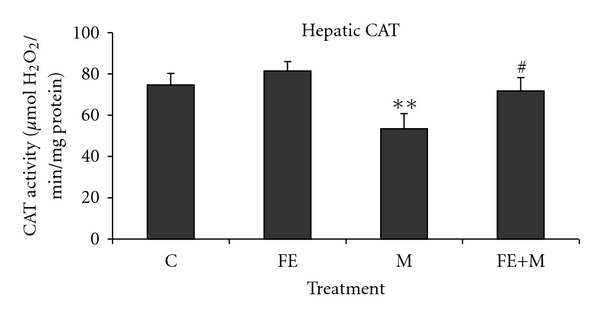
Figure 4.

Hepatic CAT of control and rats treated with methanol (M), Ficus carica stem extract (FE), and their combinations (FE + M). Significant differences: values are mean ± SEM for eight rats in each group. FE, M, and FE + M treated groups versus control group; **P < 0.01, M group versus (FE + M) group; # P < 0.05.
