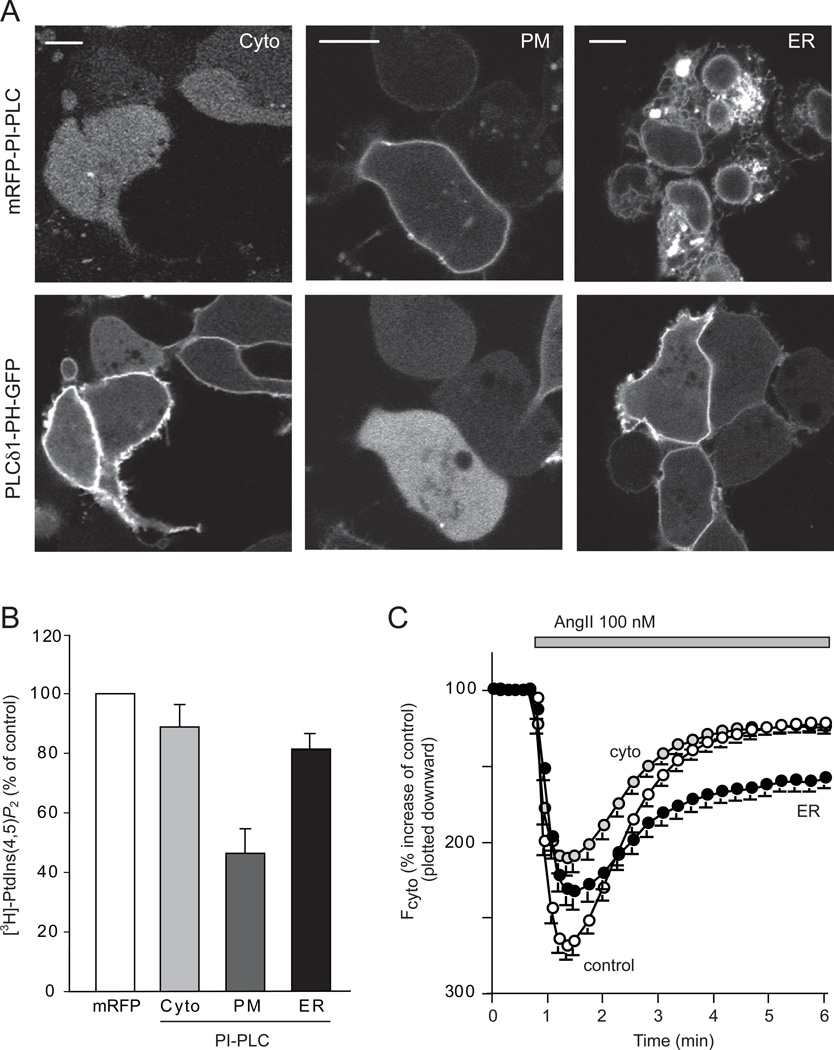
Figure 7. Effects of PtdIns depletion by expression of PI-PLC enzymes on the plasma membrane PtdIns(4,5)P2.
(A) The PtdIns(4,5)P2 sensor, PLCδ1-PH-GFP was expressed with mRFP-conjugated cytoplasmic, PM- or ER- targeted PI-PLC in HEK293-AT1 cells. Scale bars, 10 µm. (B) HEK293-AT1 cells were transfected with the various forms of PI-PLC and labeled with myo-[3H]inositol for 24 hrs as described under Methods. Labeled lipids were extracted from the cell pellets, separated by TLC, and quantified by densitometry of exposed films to measure total myo-[3H]inositol labeled PtdIns(4,5)P2 levels. Error bars indicate SEM (from 4 independent experiments, each performed in duplicates). (C) PLCδ1-PH-GFP was expressed together with mRFP only, cytoplasmic-, PM- or ER- targeted PI-PLC in HEK293-AT1 cells. After 24 hrs, cells were analyzed by confocal microscopy and time-lapse images were recorded after AngII stimulation. The average responses of the cytoplasmic fluorescence intensity of 80–100 cells (mean ± S.E.M) are shown. After normalization to pre-stimulatory levels, these intensity increases were plotted downward to better conceptualize that they reflect the PtdIns(4,5)P2 decreases in the membrane. Note the PH domain was only partially re-localized to the membrane in cells expressing ER-PI-PLC.

