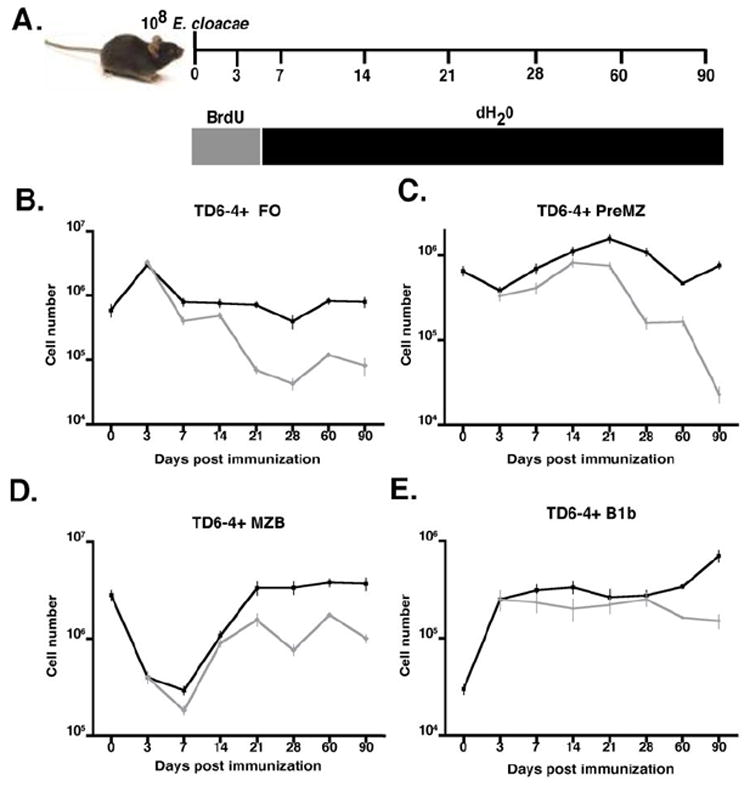
Figure 7. Analysis of J558 Id+ B cell turnover in mature B cell subsets of TG mice post E. cloacae immunization.

(A) Diagram of BrdU labeling regimen. Mice were immunized intravenously at day 0 with 108 E. cloacae and given BrdU at a concentration of .8 mg/ml in the drinking water for 3 days after immunization. Incorporation of BrdU in J558 Id+ splenic B cell subsets was evaluated. (B-E) Numbers of total J558 Id+ B cells in the different subsets (black lines) were compared to numbers of BrdU+ J558 Id+ cells in the spleen (B) FO, (C) preMZ, (D) MZ, and in the peritoneal cavity (E) B1b B cell subsets (grey lines) in TG mice pulsed for 3 days with BrdU post E. cloacae immunization.
