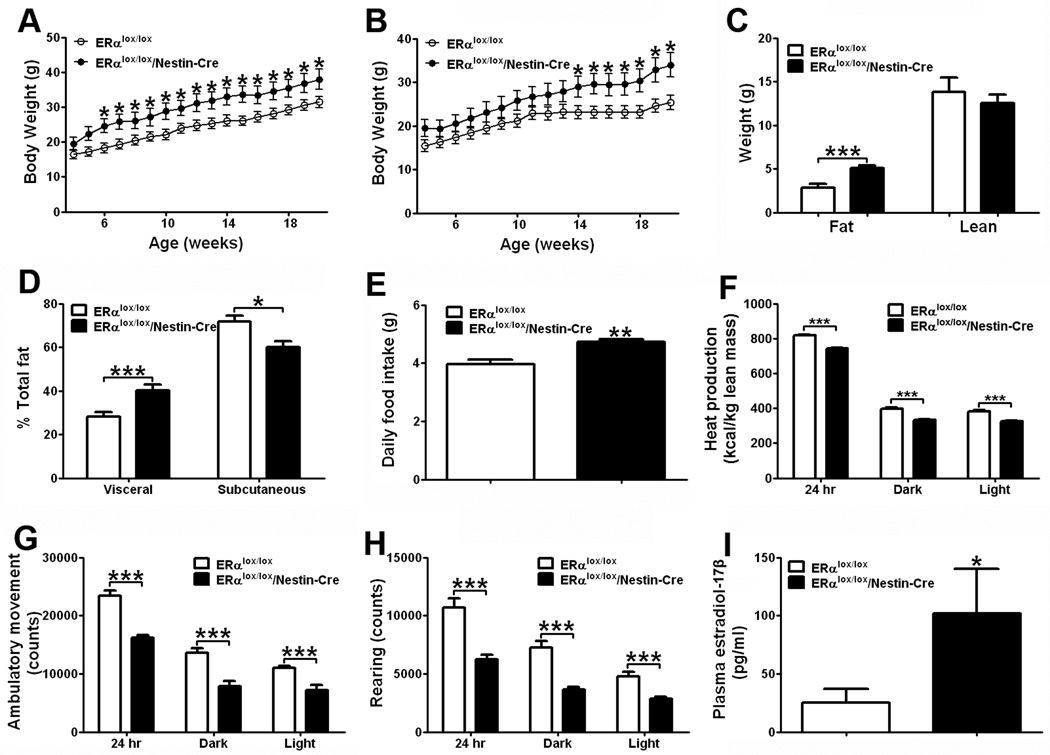
Figure 1.
CNS ERα regulates energy homeostasis. (A) Weekly body weight in male mice weaned on regular chow (n=8/genotype). (B) Weekly body weight in female mice weaned on regular chow (n=8/genotype). (C) Body composition in 15-week old female mice fed with regular chow (n=8/genotype). (D) Relative fat distribution in the visceral and subcutaneous depots in 7-week old female mice fed with regular chow (n=8 or 10/genotype). (E) Daily food intake in 7-week old female mice fed with regular chow (n=8 or10/genotype). (F–H) Chow-fed female mice (n=8 or 10/genotype) were acclimated to the TSE metabolic chambers. Average heat production (F), ambulatory movements (G) and rearing activities (H) during 24 hr, 12 hr dark cycle and 12 hr light cycle. Note: mice used in (F–H) were 12-week old littermates, and had comparable body weight (ERαlox/lox: 22.8±1.5 vs ERαlox/lox/Nestin-Cre: 27.2±2.5, P>0.05) and lean mass (ERαlox/lox: 13.80±1.72 vs ERαlox/lox/Nestin-Cre: 12.50±0.98, P>0.05), but different fat mass (ERαlox/lox: 2.80±0.45 vs ERαlox/lox/Nestin-Cre: 5.10±0.27, P<0.001). (I) Plasma estradiol-17β at diestrus in 7-week old female mice fed with regular chow (n=8 or 10/genotype). Note: mice used in (D), (E) and (I) had different total fat mass (ERαlox/lox: 3.53±0.48 vs ERαlox/lox/Nestin-Cre: 6.01±1.67, P<0.05), but comparable lean mass (ERαlox/lox: 13.51±0.21 vs ERαlox/lox/Nestin-Cre: 14.10±0.76 (P>0.05). Data are presented as mean ± SEM, and * P<0.05 and ***P<0.001 between ERαlox/lox/Nestin-Cre mice and ERαlox/lox mice.

