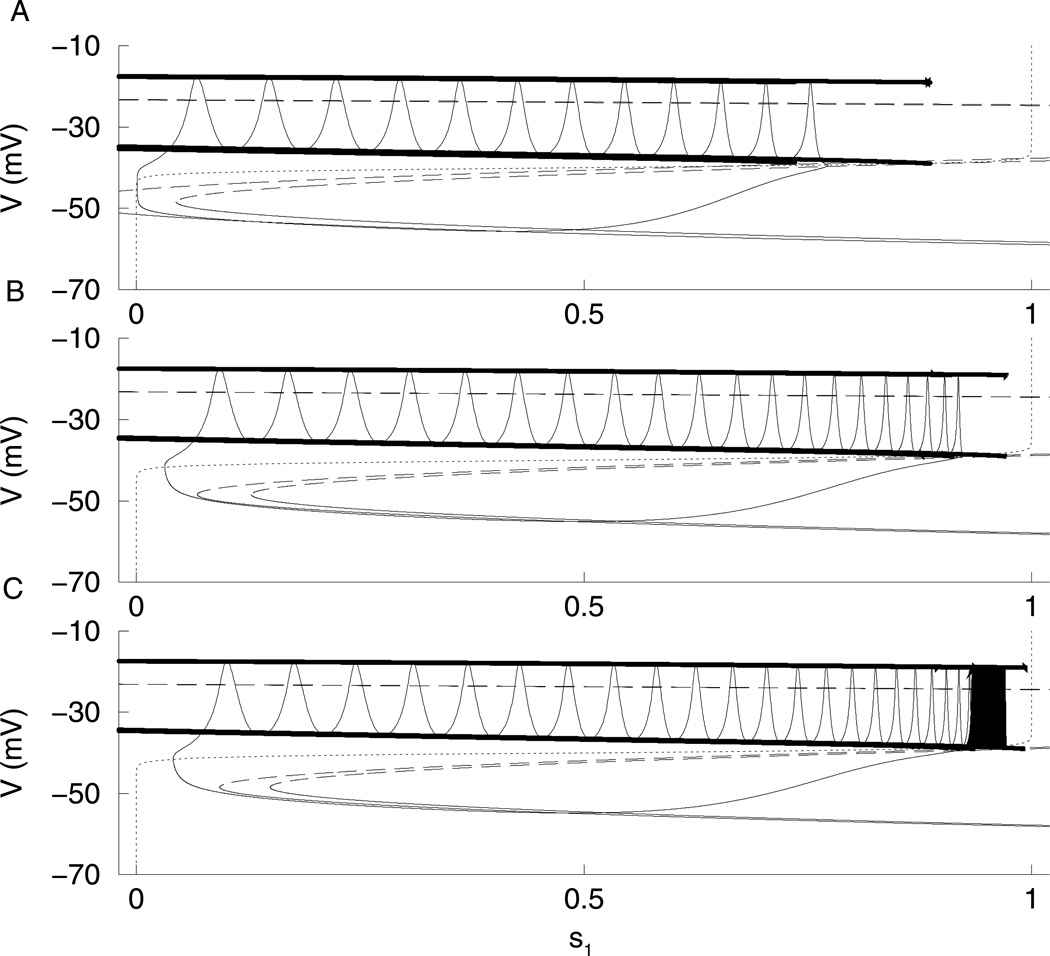
Figure 10.
Bifurcation diagrams with gs1 = 8.5 pS. The two dashed curves are the bifurcation diagrams for the extreme values of s2. (A)For gs2 = 100 pS, the phase point gets stuck in the SP. (B)For gs2 = 40 pS, the phase point does not get stuck. (C)For gs2 = 20 pS, the phase point gets stuck in the AP.

