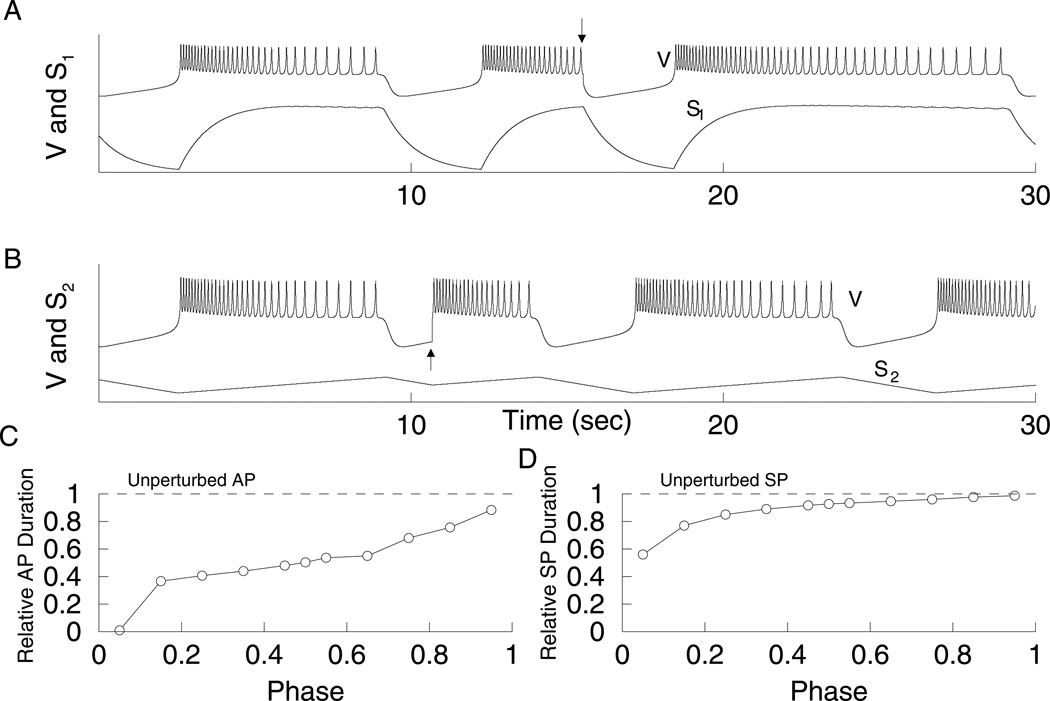
Figure 11.
Resetting with gs2 = 27 pS and gs1 = 8.5 pS. In this case, s1 is in control of the SP (DF = 0.85), while s2 is in control of the AP (DF = −0.99). (A) Half-way through the AP the system was reset to the SP (arrow), which has full length. s1 has reached its maximum at the time of resetting (bottom curve). The V and s1 time courses have been scaled to facilitate comparison. (B) Half-way through the SP the system was reset to the AP (arrow), which is reduced. s2 is in the middle of decreasing to its minimum value at the time of resetting (bottom curve). (C) The duration of the induced AP is phase dependent. (D) The duration of the induced SP is close to the duration of the unperturbed SP if the resetting occurs after s1 reaches its maximum value.

