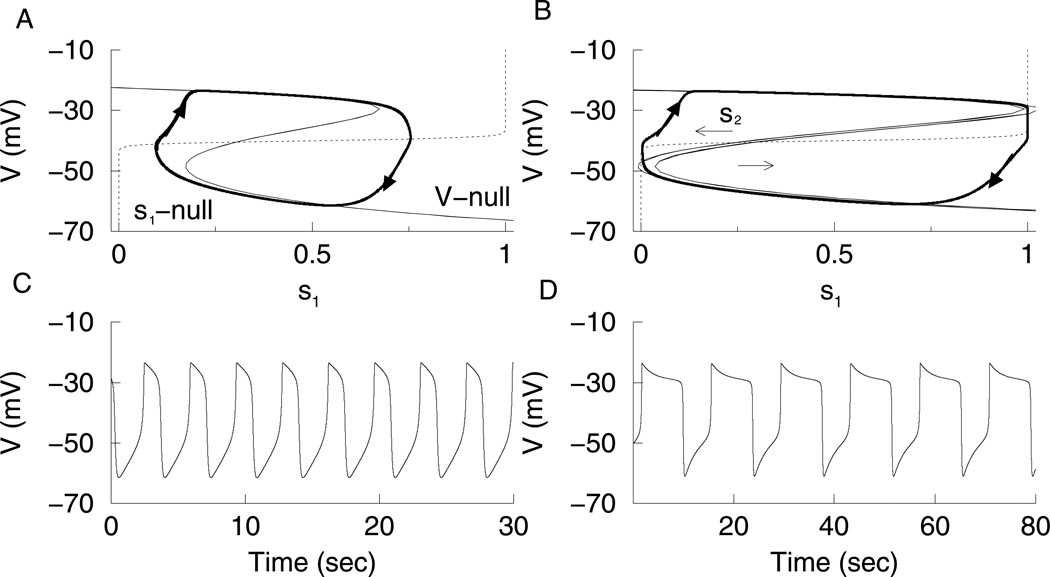
Figure 3.
Phase plane analysis of fast and medium relaxation oscillations. (A) The V-nullcline (z-shaped curve) and s1-nullcline (dotted curve) for fast oscillations with gs1 = 40 pS and s2 fixed at 0.436. The trajectory (heavy solid curve) follows the upper and lower branches of the V-nullcline. (B) The V-nullcline and s1-nullcline for medium oscillations with gs1 = 20 pS. The V-nullcline on the left has s2 at it maximum value (0.619), while the V-nullcline on the right has s2 at its minimum value (0.591). (C) Fast relaxation oscillations driven by s1. (D) Medium relaxation oscillations driven by s1 and s2.

