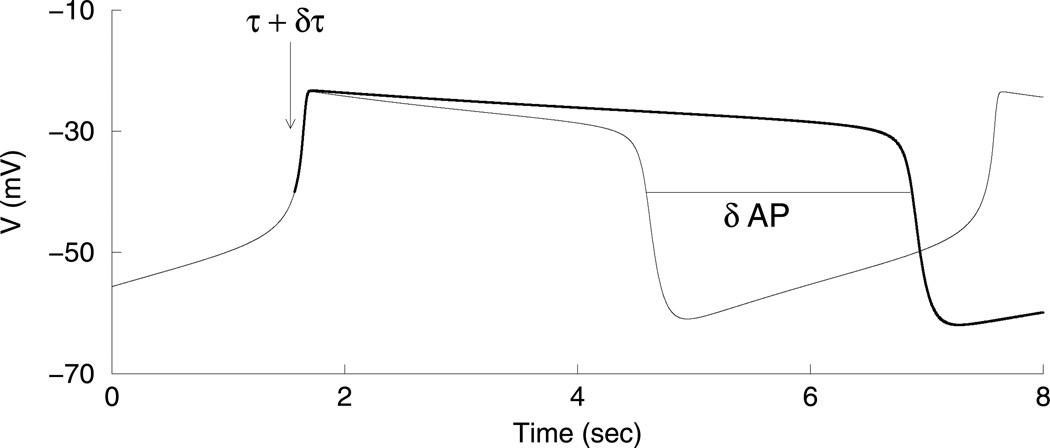
Figure 4.
Measuring the effect of a slow variable on the duration of the active phase. The time constant of the slow variable, τ, is increased by δτ at the beginning of the active phase (arrow). This causes the slow variable to slow down and the active phase duration to increase by δAP (bold curve).

