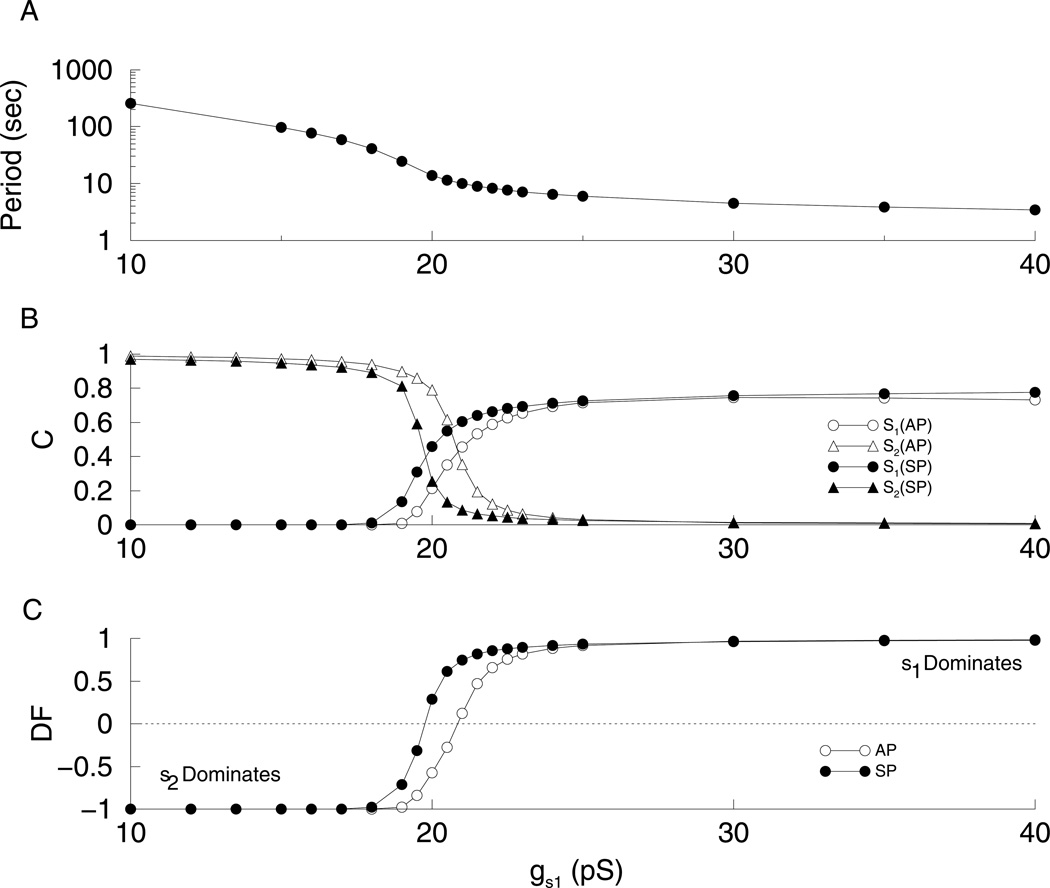
Figure 6.
Results of the quantification method on the phantom relaxation oscillator. δτ=τ here and in other figures that follow. The results obtained using δτ = 0.05τ are similar for the relaxation case. (A) Oscillation period decreases with gs1. (B) C values for active and silent phases and for s1 and s2. (C) For low values of gs1 the DF is close to −1 indicating that s2 is the variable driving slow oscillations, while for high values of gs1 DF is close to 1 indicating that s1 is the variable driving slow oscillations.

