Figure 2.
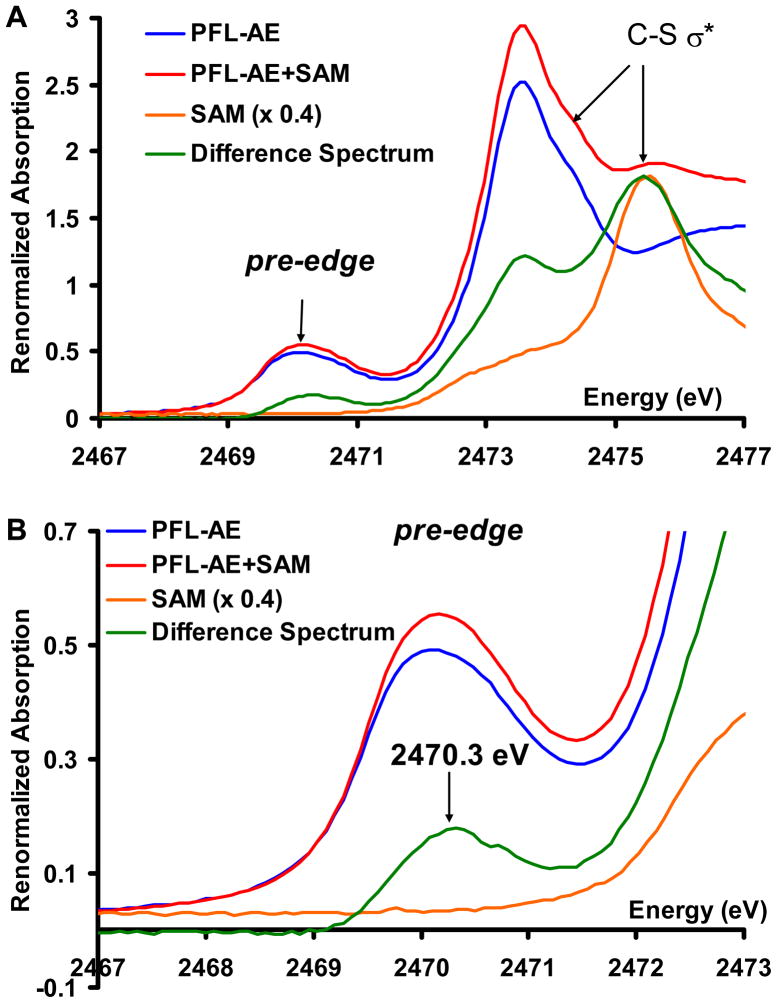
A) Figure 2: A) S K-edge XAS data of the resting PFL-AE enzyme (blue), SAM bound PFL-AE (red), the difference spectrum (green, representing the difference between SAM bound and resting PFL-AE) and free SAM in solution (orange). B) Pre-edge energy region of the XAS data of the resting PFL-AE enzyme (blue), SAM bound PFL-AE (red), the difference spectrum (green) and free SAM in solution (orange). Expanded pre-edge region shown in SI

