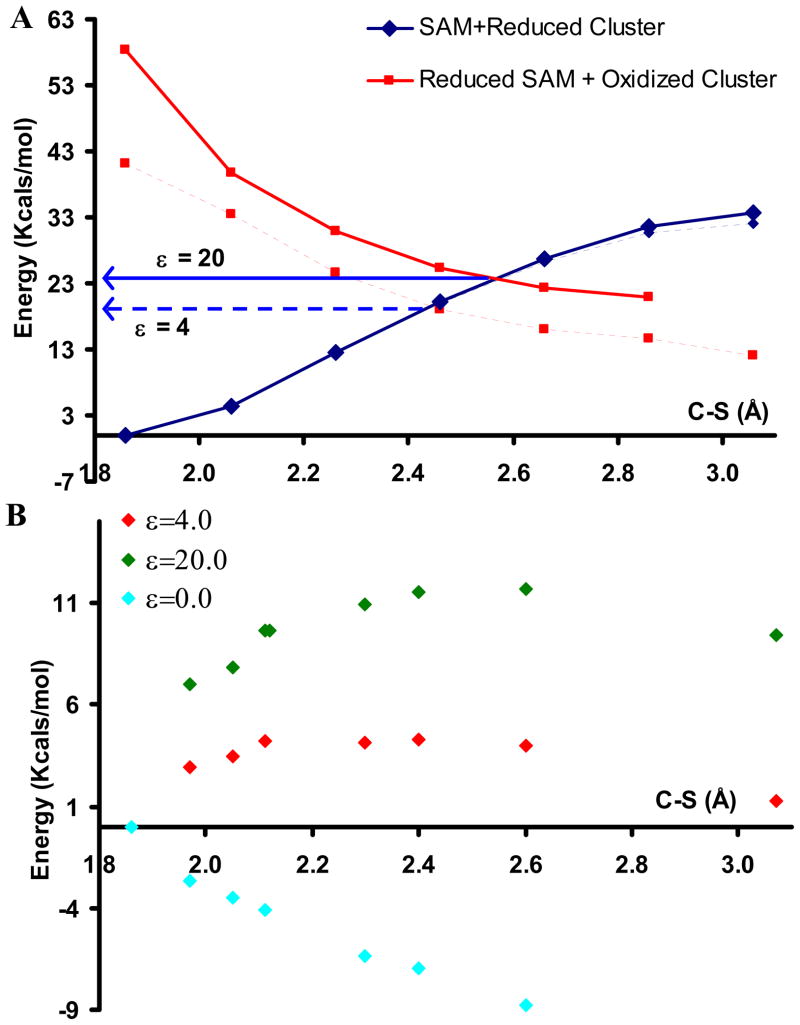
Figure 5.
A) Potential Energy Surface of C-S bond cleavage in the outer-sphere model with an ε=4.0 (dashed lines) and ε=20.0 (bold lines). The blue line indicates the reactant surface and the red line indicates the product surface. B) The potential energy surface of the C-S bond cleavage in the inner-sphere model in gas phase (cyan), ε=4.0 (red) and ε=20 (green).

