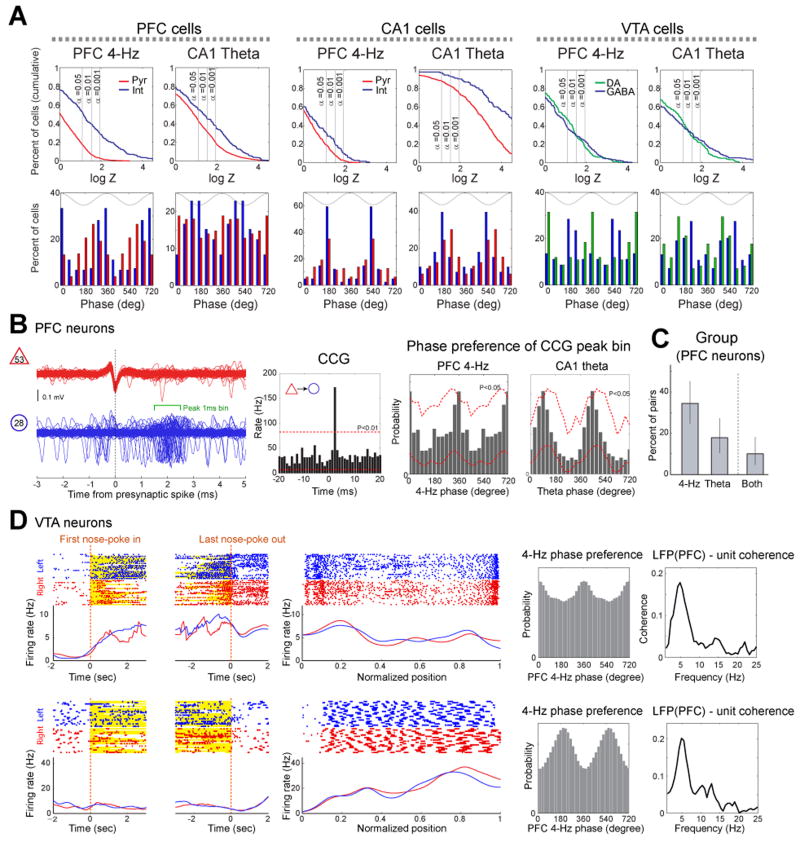
Figure 4.
Entrainment of unit firing by 4-Hz and theta oscillations. (A) Top, cumulative density function of phase modulation strength statistics logZ (Rayleigh statistics Z; Sirota et al., 2008) for putative pyramidal cells (red), GABAergic inhibitory cells (blue) and dopaminergic cells (green) from PFC (left), CA1 (middle) and VTA (right). Bottom, distribution of preferred phases for all significantly modulated (P<0.05) neurons. (B) Modulation of synaptic connections by 4-Hz and theta oscillations. Left, filtered traces of a synaptically connected PFC putative pyramidal cell (triangle)-interneuron (circle) pair and their cross-correlogram (CCG, second panel). Spike transmission efficacy was estimated by the short-term cross-correlograms between neuron pairs. Note short-latency (∼2ms) firing of the interneuron after the pyramidal cell spike in an example pair. Third and fourth panels, phase distribution of coincident spikes of the example pyramidal cell-interneuron pair (co-firing within 1-msec windows, 1 msec after pyramidal cell spike; Fujisawa et al., 2008) during PFC 4-Hz and hippocampal theta oscillations. Red lines: significance level estimated by permutation test (P<0.05; Fujisawa et al., 2008). (C) Percent of monosynaptically connected PFC pyramidal-interneuron pairs significantly modulated by either or both rhythms. Clopper-Pearson confidence intervals (P<0.05) are also shown. (D) Raster plots of unit firing and mean rates during left- (blue line) and right-bound (red line) trials for two representative VTA units related to nose poking onset (0 sec; left panel), offset (0 sec; 2nd panel) and activity (third panel) in the maze. Histogram: modulation of unit firing by PFC 4-Hz. Rightmost panel: Coherence between LFP in PFC and unit firing. Top unit shows increased firing rate at sniffing onset. Bottom unit fired rhythmic bursts of spikes during running (note rhythmicity of spikes).

