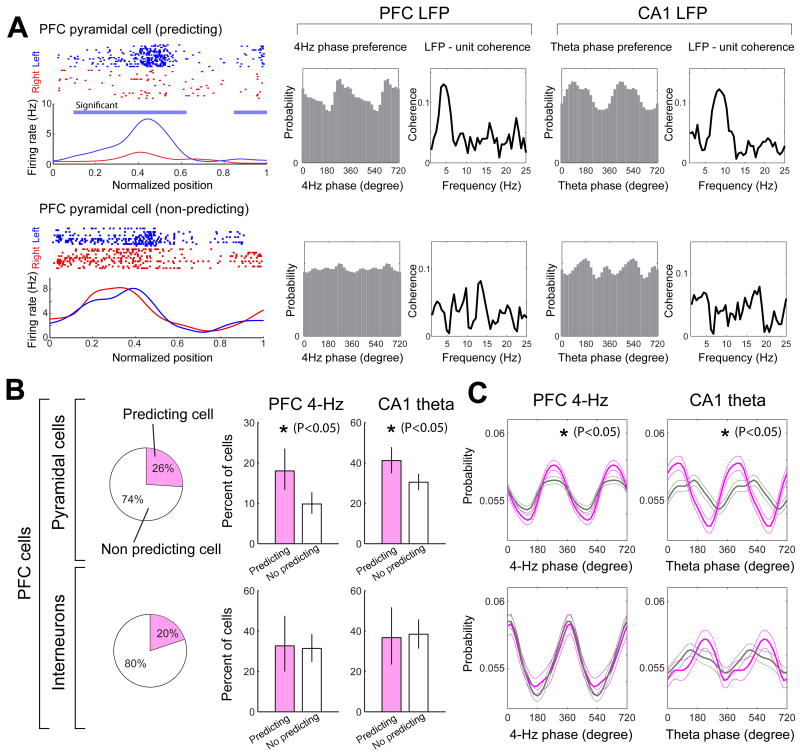
Figure 6.
Trial outcome-predicting PFC neurons are more strongly modulated by the 4-Hz oscillation than non-predicting cells. (A) Raster plots and mean firing rates for two example PFC neurons during left (blue) and right-bound (red) trials. Blue horizontal line: significant difference (P<0.05; permutation test; Fujisawa et al., 2008) between left and right trials. Top row, side-predicting neuron with strong unit-LFP coherence at 4-Hz. Bottom, non-predicting neuron with poor unit-LFP coherence. (B) Pie charts, fractions of side-predicting (pink; significantly different mean discharge rates at position 0-0.3 in left and right trials; P<0.05) and non-predicting (white) neurons. Graphs, percentage of PFC neurons significantly phase-locked to PFC 4-Hz or hippocampal theta oscillations in the central arm. Clopper-Pearson confidence intervals (P < 0.05) are shown. (C) Mean phase modulation of predicting (pink) and non-predicting (gray) PFC neurons by 4-Hz and theta oscillations. Peak-to-trough height of the phase histograms was used for the assessment of statistical significance (P<0.05; permutation test).

