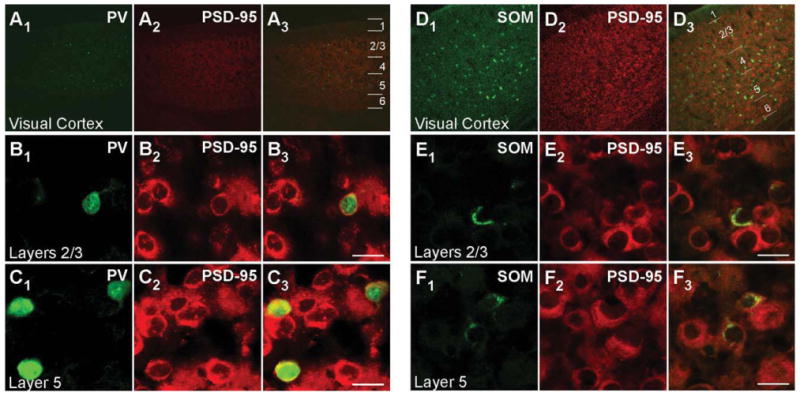
Figure 1.

PSD–95 mRNA expression in PV+ and SOM+ interneurons in juvenile (P15) mouse visual cortex. Confocal images of combined in situ hybridization and immunohistochemistry for PSD–95 and either PV or SOM in the mouse visual cortex. Tissue sections were obtained from juvenile (P15) mouse visual cortex. In the left columns, sections were labeled with rabbit anti-PV (green; A1,B1,C1) or rat anti-SOM (green; D1,E1,F1). In the middle columns (A2,B2,C2,D2,E2,F2), the same sections were hybridized with DIG-labeled PSD-95 riboprobe (red). Our riboprobe detected both spliced isoforms (α and β) of PSD-95. The right columns (A3,B3,C3,D3,E3,F3) show merged images. The visual cortex is shown at low magnification (×10; A1–A3,D1–D3), with approximate boundaries between layers demarcated in A3,D3. Other images are at ×63, highlighting layers 2/3 (B1–B3,E1–E3) or layer 5 (C1–C3,F1–F3) to show cell-type-specific expression of PSD-95. For magenta-green images see Supporting Information Figure 7. Scale bars = 20 μm.
