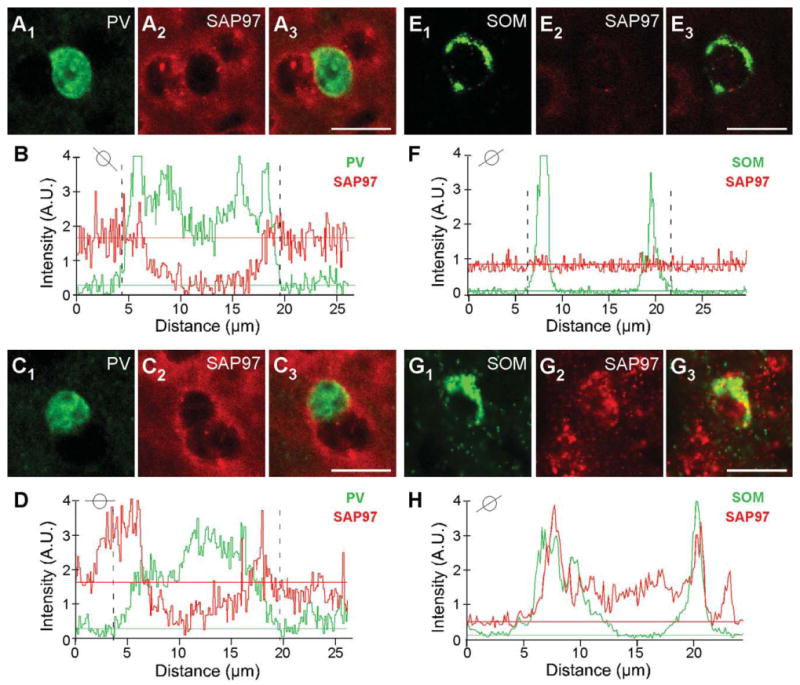
Figure 7.

Colocalization analysis of SAP97 and PV or SOM. A1–A3,C1–C3: Confocal images of an adult mouse brain section labeled with rabbit anti-PV (green) and hybridized with DIG-labeled SAP97 riboprobe (red; enlarged version of Fig. 6B1–B3). B,D: Plots of the signal intensities of PV (green) and SAP97 (red; B, low expressing; D, high expressing) for a line that cuts through each of the immunopositive (PV+) cells (see small circle insets). The analysis is identical to that in Figure 3. In B, a peak SAP97 signal relative to its baseline is difficult to identify, and the PV+ cell was scored negative. Note that, in this instance, we avoided drawing analysis lines that went through the adjacent non-PV+ cells. In D, although there are background complications, a peak SAP97 signal could be associated with the PV signal. E1-E3,G1-G3: Confocal images of an adult mouse brain section labeled with rat anti-SOM (green) and hybridized with DIG-labeled SAP97 riboprobe (red; enlarged version of Fig. 6D1-D3,E1-E3). F,H: Plots of the signal intensities of SOM (green) and SAP97 (red; F, low expressing; H, high expressing) for a line that cuts through each of the immunopositive cells (see small circle insets). A peak SAP97 signal was not present, and the SOM+ cell was scored negative. In H, the peak SAP97 signal matches and overlaps with the SOM signal. A.U., arbitrary units. For magenta-green images see Supporting Information Figure 13. Scale bars = 20 μm.
