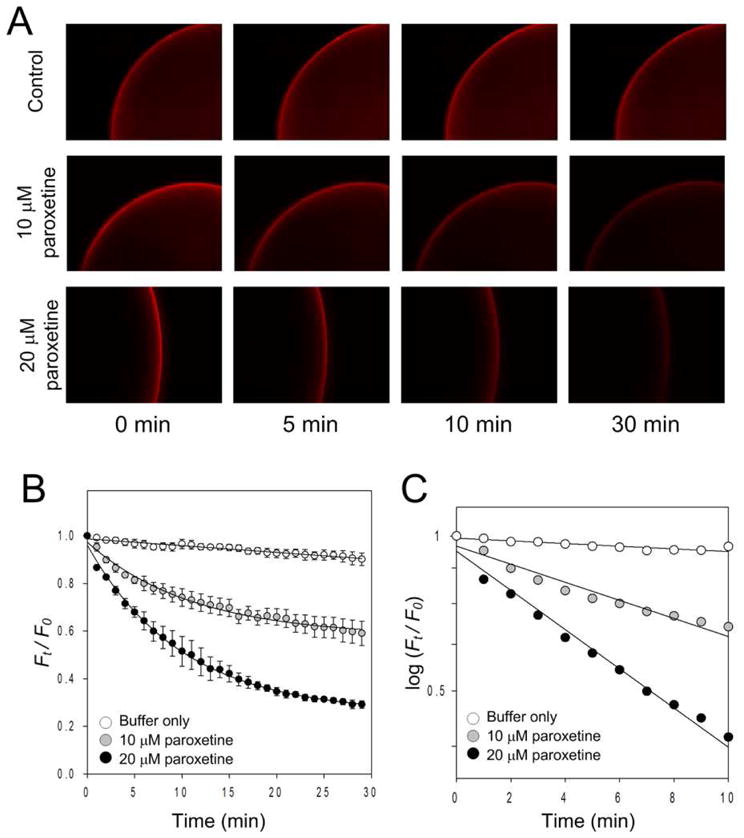
Figure 3.

Displacement analysis of the QD-ligand labeled hSERT with paroxetine. Representative time-lapse Qdot fluorescent images (A), time-dependent relative fluorescent intensity plot (B), and kinetic analysis (C) show the effect of paroxetine on ligand-SERT displacement in the presence of PBS buffer (control), 10 μM, and 20 μM paroxetine. Solid lines in (B) reflect best fits (see suppl for detail). A log scale plot of the displacement curves is fit to a linear function (C), indicating first-order dissociation kinetics. Each data point in (B) and (C) represents the mean of three independent measurements. Data points in (B) are given as mean ± standard deviation. Results in A are representative micrographs from at least 3 independent experiments.
