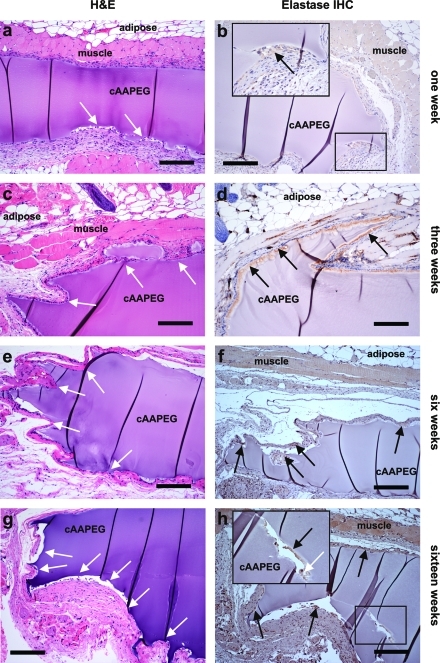
Figure 5.
Histological (a, c, e, g) and immunohistochemical (b, d, f, h) analysis of subcutaneously implanted cAAPEG confirmed in vivo neutrophil elastase-mediated degradation of this material. Scale bars: 200 μm, all images. White arrows: site of cellular infiltration into the cAAPEG adhesive hydrogel. Black arrows: positive neutrophil elastase stain.

