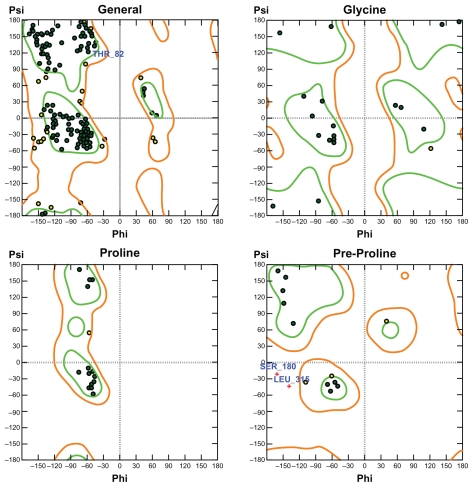
Figure 2.
Ramachandran plots for the m11βHSD2 model. For m11βHSD2, 87.1% of the residues are in the favored region, 11.8% are in the allowed region and only 1.1% are in the disfavored region. The residues in the disfavored regions are located far away from the residues in the LBSs. Green: favored region. Light-brown: allowed region.

