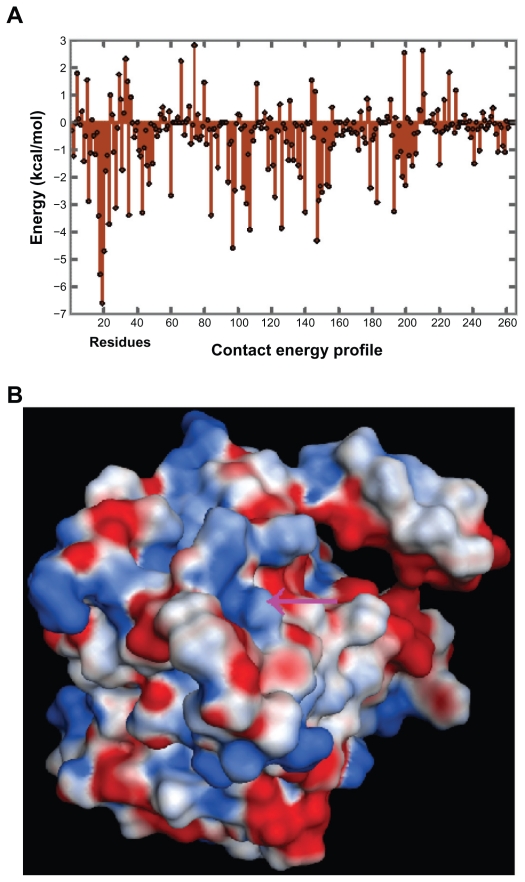
Figure 3.
(A) Contact energy profiles of m11βHSD2. The positions of the amino acid residues are shown on the x-axis, while the contact energies are shown on the y-axis. The trends in the variation of the contact energy in most parts of the m11βHSD2 model are in good agreement with those of the structures of h11βHSD1 and 2,18 indicating that the h11βHSD2 and m11βHSD2 models exhibit similar contact energy profiles. (B) The MEP map for the m11βHSD2 model at the LBS. Arrows: LBS. Deep blue: most positive potential. Deep red: most negative potential. The model exhibits an almost identical surface MEP map at the LBS in h11βHSD2,18 sharing common features such as a positively charged surface.

