
Figure 2.
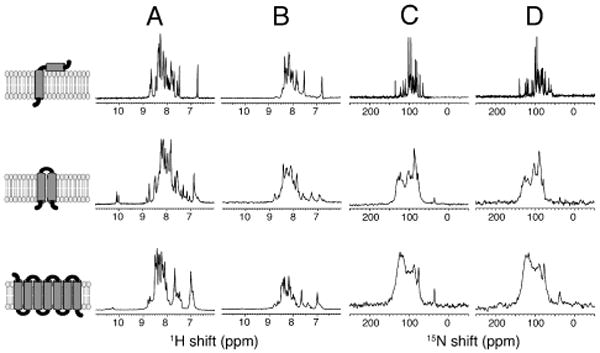
NMR spectra of uniformly 15N-labeled membrane proteins in four different membrane-mimic environments. (A) q=0.1 bicelles. (B) Nanodiscs. (C) Macrodiscs. (D) q=5 bicelles. From top to bottom, the leftmost column contains cartoon representations of the membrane proteins with one (Pf1 coat protein), two (p7 protein), and seven (CXCR1) trans-membrane helices. (A and B) 15N-edited 1H solution NMR spectra. (C and D) OS solid-state 15N NMR spectra. The nanodisc and macrodisc samples are as described in Figure 1.