
Figure 3.
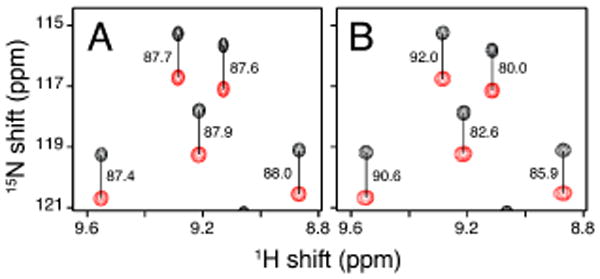
Representative region of 1H-15N IPAP-HSQC spectra of uniformly 15N labeled interleukin-8 at 40°C. (A) Isotropic in aqueous solution. (B) Weakly aligned in aqueous solution by the addition of macrodiscs in a final concentration of 10% DMPC (w/v). The measured values of one-bond 1H-15N splitting are marked in Hz.