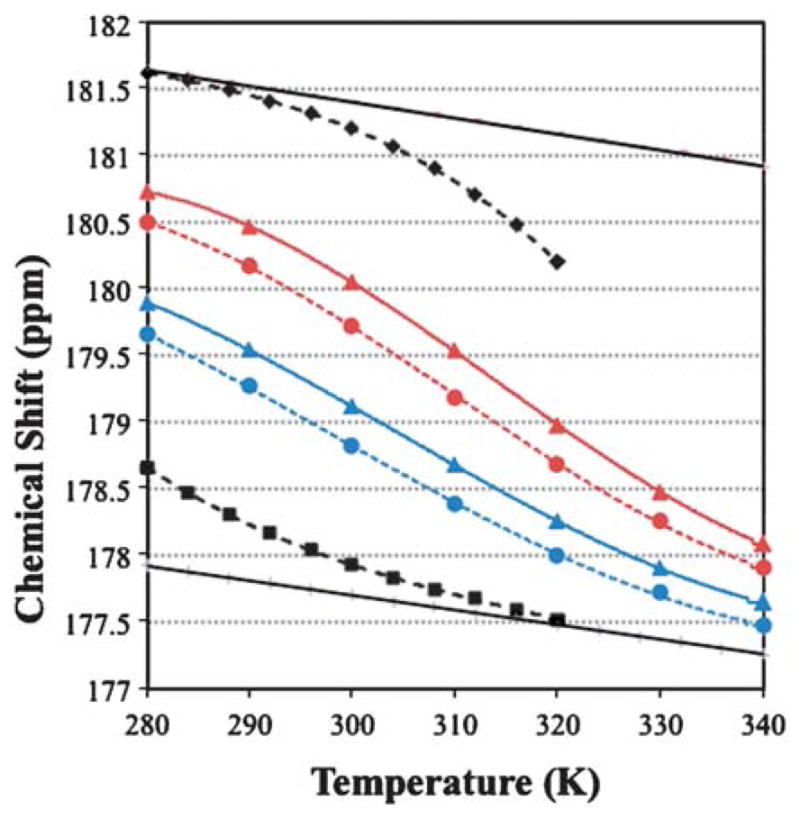
Fig. 1.

Melting curves for 13C=O chemical shifts. The data for DAYAQWLKDGGPSSGRPPPS and NAYAQWLKDGKK appear in black with the derived 100% and 0% helix lines. The data for Ac-WAAAHAAARAA
 AXAA
AXAA
 ARAA-NH2 is color coded by alanine position, with the X = A data shown as ▲ connected by a solid line and X = K as ● connected by a dashed line. The 100% and 0% helix lines for –RAA
 AXAA
AXAA
 AR– appear in the Electronic Supplementary Information together with the method employed to convert CSDs to helix propagation values.†
