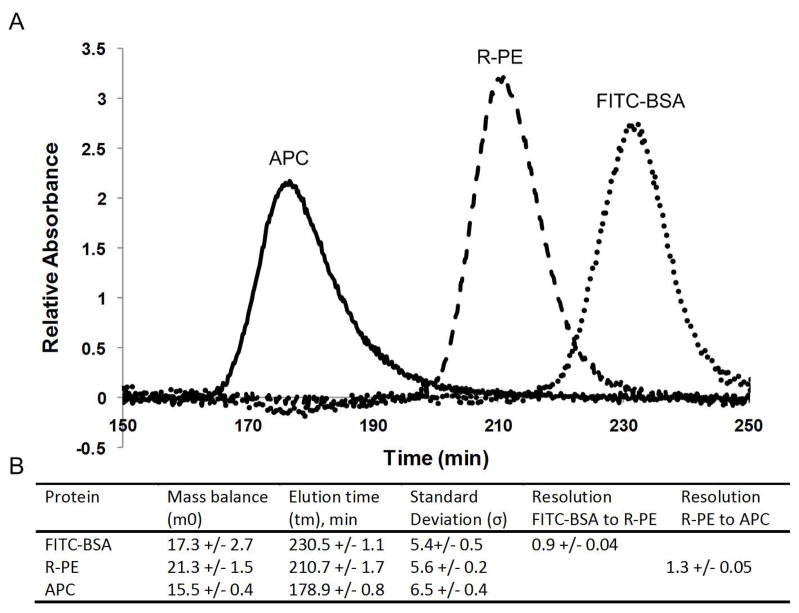
Figure 2.
Normal polarity experimental results. (A) Representative electropherogram showing the separation of FITC-BSA, R-PE and APC. (B) Moment analysis results. The three experimental runs show very good reproducibility with the retention times of each the peaks showing less than 1% run-to-run variation. The peak standard deviations (σ) exhibit more run-to-run variation, but still agree within 10%.

