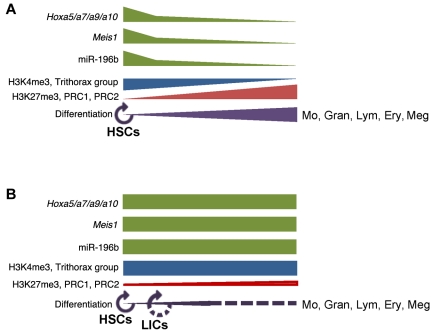
Figure 4.
Simplified model of the relationship between Hoxa cluster gene expression and epigenetic modifications. (A) During normal hematopoiesis, Hoxa and miR-196b transcript levels are highest in HSPCs and decrease as cells differentiate to functional mature hematopoietic cells. In immature HSPCs, active histone marks such as H3K4me3 and the presence of trithorax group proteins correlate with high levels of Hoxa transcripts. These transcriptional enhancer marks decrease as cells mature and differentiate, and the Hoxa locus becomes progressively silenced by repressive H3K27me3 marks and polycomb repressor complex (PRC) group proteins (129,130-134; [130-134 are reviews]). (B) Mis-regulated Hoxa cluster gene expression associated with NUP98 fusion leukemogenesis, as a result of aberrant chromatin-modifying activities conferred by the NUP98 fusion.39,47 Mo indicates monocytes; Gran, granulocytes; Lym, lymphocytes; Ery, erythrocytes; Meg, megakaryocytes; and LICs, leukemia-initiating cells.

