Figure 1.
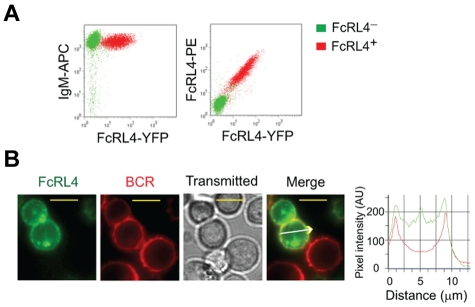
Expression and distribution of FcRL4 and BCR in Ramos cells. Ramos cells were transfected with FcRL4-YFP and cells stably expressing FcRL4-YFP were selected. (A) FcRL4− and FcRL4+ cells were labeled with APC-conjugated mAb specific for the human IgM (anti-IgM–APC) and PE-conjugated mAb specific for the FcRL4 (anti-FcRL4–PE) and the cell-surface expression of IgM and FcRL4 was quantified by flow cytometry. (B) The distribution of FcRL4-YFP and Fab anti-IgM–DyLight649 labeled BCR in resting cells is shown as pseudo-color epifluorescence images of FcRL4-YFP (green), BCR (red), and bright field transmitted and merged images. Images were acquired on an Olympus IX-81 microscope equipped with 100 × 1.45 numerical aperture objectives lens as described in “Preparation of PLBs and live cell imaging.” The yellow scale bars represent 10 μm. Pixel intensities of FcRL4-YFP (green) and the BCR (red) in the direction by the white arrow are shown in a representative cell.

